

The asparaginyl hydroxylase factor inhibiting HIF-1alpha is an essential regulator of metabolism
- PMID: 20399150
- PMCID: PMC2893150
- DOI: 10.1016/j.cmet.2010.03.001
The asparaginyl hydroxylase factor inhibiting HIF-1alpha is an essential regulator of metabolism
Abstract
Factor inhibiting HIF-1alpha (FIH) is an asparaginyl hydroxylase. Hydroxylation of HIF-alpha proteins by FIH blocks association of HIFs with the transcriptional coactivators CBP/p300, thus inhibiting transcriptional activation. We have created mice with a null mutation in the FIH gene and found that it has little or no discernable role in mice in altering classical aspects of HIF function, e.g., angiogenesis, erythropoiesis, or development. Rather, it is an essential regulator of metabolism: mice lacking FIH exhibit reduced body weight, elevated metabolic rate, hyperventilation, and improved glucose and lipid homeostasis and are resistant to high-fat-diet-induced weight gain and hepatic steatosis. Neuron-specific loss of FIH phenocopied some of the major metabolic phenotypes of the global null animals: those mice have reduced body weight, increased metabolic rate, and enhanced insulin sensitivity and are also protected against high-fat-diet-induced weight gain. These results demonstrate that FIH acts to a significant degree through the nervous system to regulate metabolism.
Conflict of interest statement
We declare there are no conflicts of interest.
Figures
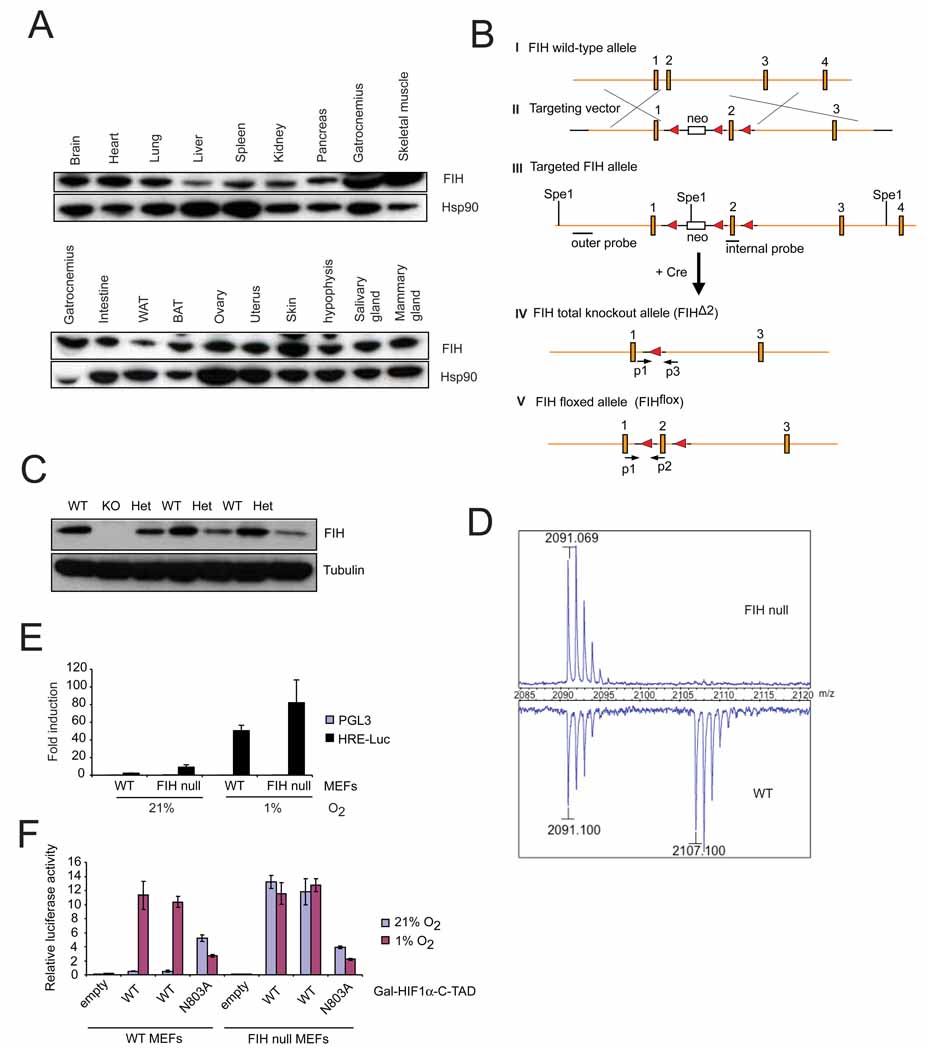
Immunoblotting for FIH in adult mouse tissues. Various organs from a 2-month old wild type female were harvested and frozen at −80°C before lysis. Whole cell extracts were obtained and immunoblotted for FIH. Hsp90 was used for the loading control.
Strategy of targeting the FIH gene. The genomic wild-type FIH locus around exon 1–4 (filled boxes) is shown (I). A neo cassette (open box) and a loxP sites (filled triangle) from the targeting vector (II) were introduced upstream and downstream of exon 2 by homologous recombination (III), respectively. Restriction sites (SpeI) and positions of outer and internal probes for Southern blotting are indicated. After Cre-mediated excision, the FIH total knockout allele (FIHΔ2) (IV) and the FIH floxed allele (FIHflox) (V) were obtained. PCR primers used for genotyping (p1, p2, p3) are indicated (arrows).
Immunoblot analysis of E12.5 whole embryo lysates of wild-type (WT), heterozygous (Het) and knockout (KO) using FIH and tubulin antibodies.
MALDI-TOF-MS spectra of asparaginyl hydroxylation on HIF-1α in immortalized WT and FIH null MEFs under normoxia (21% O2).
Luciferase assay using HRE (hypoxia response element) reporter in immortalized WT and FIH null MEFs under normoxia and hypoxia (1% O2) (n=3/each). Luciferase activity was measured 24hr following transfection.
Luciferase assay using Gal-HIF1α-C-TAD reporter in immortalized WT and FIH null MEFs under normoxia and hypoxia. WT is the wild type form of HIF1α-C-TAD. N803A is the mutant form in which asparagine 803 is mutated.
Values in graphs are expressed as mean ± standard error of the mean (SEM).
See also Figure S1.

Representative quantitative PCR (qPCR) analysis of mRNA levels for Vegf, Pgk and Glut-1. Immortalized WT and FIH null MEFs were treated under normoxia and hypoxia for 16 hours. Results were normalized to β-actin.
Growth of WT and FIH null MEFs was examined under normoxia and hypoxia. Cells seeded at a low density were incubated in normoxic or hypoxic conditions and harvested for cell counts every 24hr. The average cell number of triplicates for each condition is shown.
Immunoblotting for HIF-1α, FIH and VHL from whole cell lysates of immortalized WT, FIH null, VHL null and VHL/FIH double null MEFs. Cells were treated under normoxia or hypoxia for 16 hours before harvest. Tubulin was used as the loading control.
and (E) Representative qPCR analysis of mRNA level for Vegf (D) and Car9 (E) in WT, VHL null and VHL/FIH null MEFs (n=3/genotype).
and (G) mRNA levels of both Vegf (F) and Car9 (G) were restored by a triple deletion of VHL, FIH and HIF-1α. For (D–F), cells were cultured under normoxia. Primers specific for β-actin were used for normalization.
Venn diagram showing the numbers of up and down-regulated genes in MEFs using a filter of >=2-fold change.
VHL and FIH have synergistic effects on regulating cell growth. They were restored by deletion of HIF-1αMEFs were seeded at a low density and incubated under normoxia or hypoxia for 48 hr. Cell numbers of each nullizygous MEFs were counted and normalized to relative wild-type MEFs (n=3/condition).
Values in graphs are expressed as mean ± SEM. p values are from Student’s t-test.
See also Table S1.
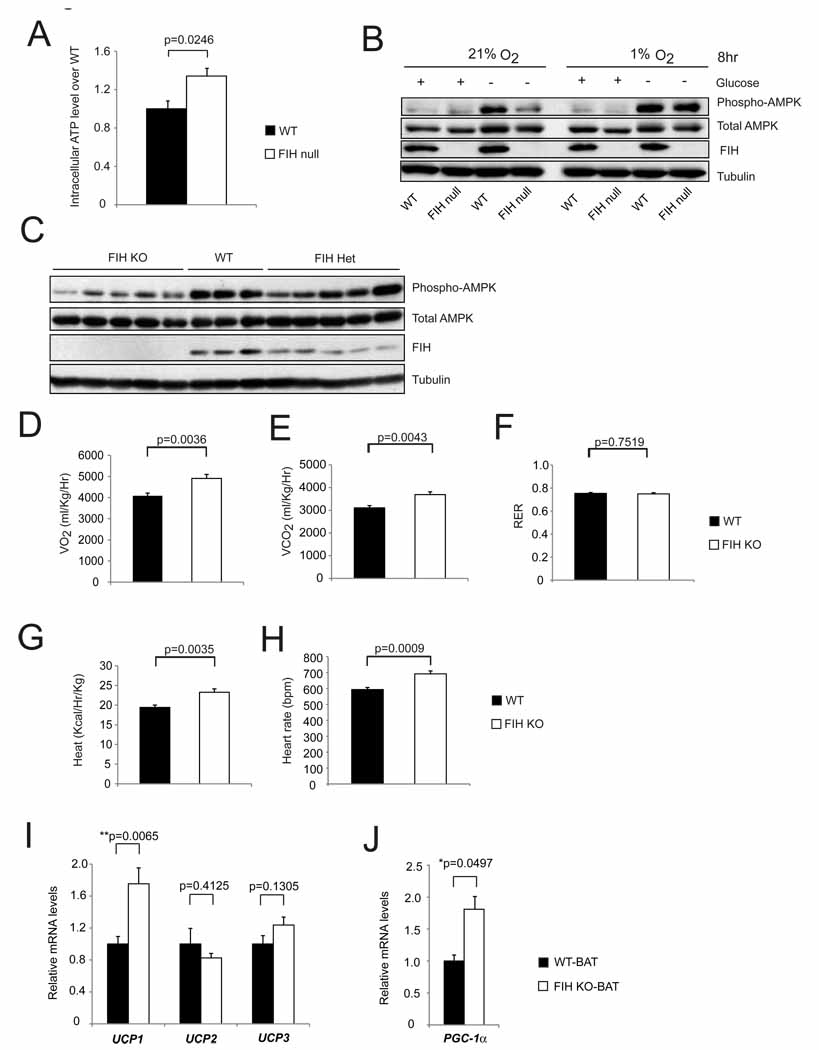
Intracellular ATP levels in primary WT and FIH null MEFs under normoxia (n=3/group).
Levels of phospho-AMPK and total AMPK were measured by immunoblotting with whole cell lysates from primary WT and FIH null MEFs treated with conditions as indicated.
Immunoblotting analysis of whole cell lysates from E12.5 WT (n=3), FIH Het (n=5) and FIH KO (n=5) embryos using phospho-AMPK, total AMPK, FIH and tubulin antibodies.
Resting whole-body O2 consumption (VO2) in 2-month old WT (n=7) and FIH KO (n=5) mice. Shown are the average value over 3 hr.
Resting CO2 production (VCO2) in the same mice as in (D).
RER (respiratory exchange ratio) were determined during the same period as in (D).
Heat production was determined during the same measurement as in (D).
Heart rates were measured in resting 2-month old WT (n=9) and FIH KO (n=5) mice under normoxic condition.
UCP1, UCP2 and UCP3 mRNA levels in brown adipose tissue (BAT) from 5-month old mice under normal chow were measured by qPCR (n=6/genotype).
PGC-1α mRNA levels in BAT from 5-month old mice under normal chow were measured by qPCR (n=6/genotype).
For gene expression analysis in (I) and (J), specific primers for β-actin were used for normalization.
Values shown in graphs are expressed as mean ± SEM. p values are from Student’s t-test.
See also Figures S2 and S3.
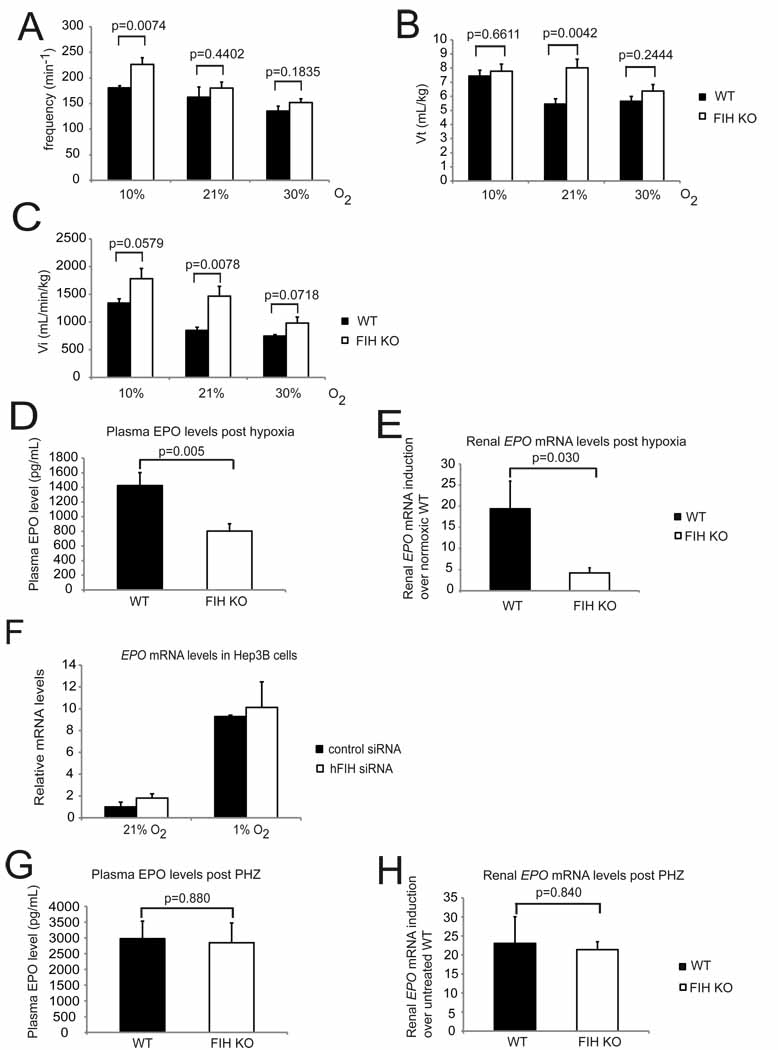
Respiration frequencies of unrestrained WT (n=7) and FIH KO (n=8) mice under acute hypoxia (10% O2), room air (21% O2), and hyperoxia (30% O2) were measured using barometric pressure plethysmography.
Tidal volume (Vt) was measured in the same assay as in (A).
Inspired minute ventilation (Vi) was determined in the same assay as in (A).
Plasma EPO levels in WT and FIH KO mice following acute hypoxic exposure at 9% O2 for 14 hours (n=15/genotype).
Analysis of renal EPO mRNA levels in hypoxia-treated WT (n=7) and FIH KO (n=8) mice (9% O2, 14 hr) by qPCR. Kidneys were collected immediately after hypoxia treatment, fast frozen in liquid N2 and stored at −80°C before RNA isolation.
Representative qPCR analysis of mRNA levels for EPO in Hep3B cells following control or hFIH siRNA treatment. Cells were cultured under normoxic or hypoxic conditions for 16 hr before harvest (n=3/condition).
Plasma EPO levels in WT (n=6) and FIH KO (n=5) mice after overnight PHZ treatment.
qPCR analysis of renal EPO expression in PHZ-treated mice (same as those in (G)).
Results in (E), (F) and (H) were normalized to β-actin.
Values shown in graphs are expressed as mean ± SEM. p values are from Student’s t-test.
See also Table S2.
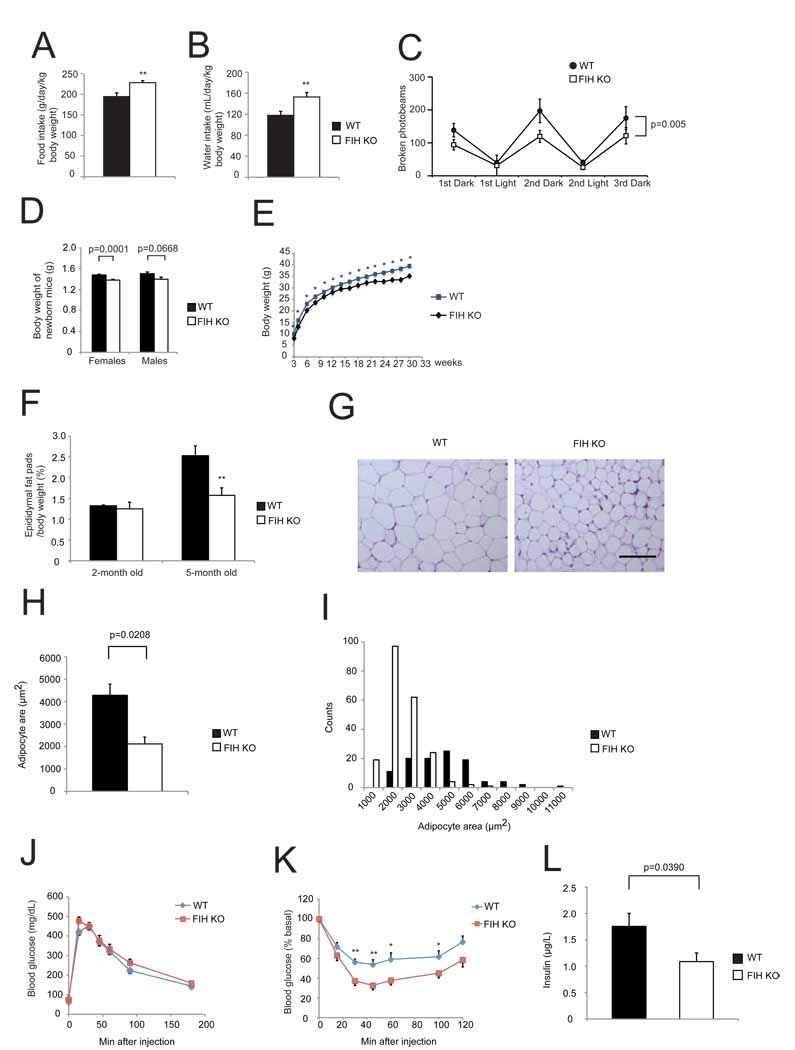
Food intake was measured in WT and KO mice (n=8/genotype) over 3 day/night cycles as monitored by CLAMS.
Water intake was measured in the same assay as in (A).
Physical activity was measured in the same assay as in (A) and (B). p=0.005 by two-way ANOVA.
Body weights of newborn WT and KO mice. n=17–18 for females. n=11–14 for males, respectively.
FIH KO mice are significantly smaller than their WT littermates. Growth curves show the average weights of WT (n=34) and KO (n=22) males. *p<0.05.
Epididymal white fat pads weight normalized with body weight was measured from 2-month old and 5-month old WT and KO male mice. **p<0.01.
Representative images of H&E stained epididymal WAT sections from 5-month old WT and KO mice fed with normal chow (NC). The scale bar represents 100µm.
Epididymal adipocyte areas were measured from 5-month old WT and KO mice. n=3/genotype.
Counts of adipocytes in different sizes from the same mice used in (H).
Glucose tolerance test (GTT) was measured for 18hr-fasting 2-month old WT and KO mice fed with NC (2g D-glucose/kg body weight). n=10/genotype.
Insulin tolerance test (ITT) was performed on 4hr-fasting 2-month old WT and KO mice fed with NC (0.75U/kg body weight). n=10–11/genotype. *p<0.05, **p<0.01.
Fed insulin levels were measured on 5-month old WT and KO mice. n=9/genotype.
Values shown in graphs are expressed as mean ± SEM. p values are from Student’s t-test (except (C)).
See also Figure S4, Table S3, and Table S4A.
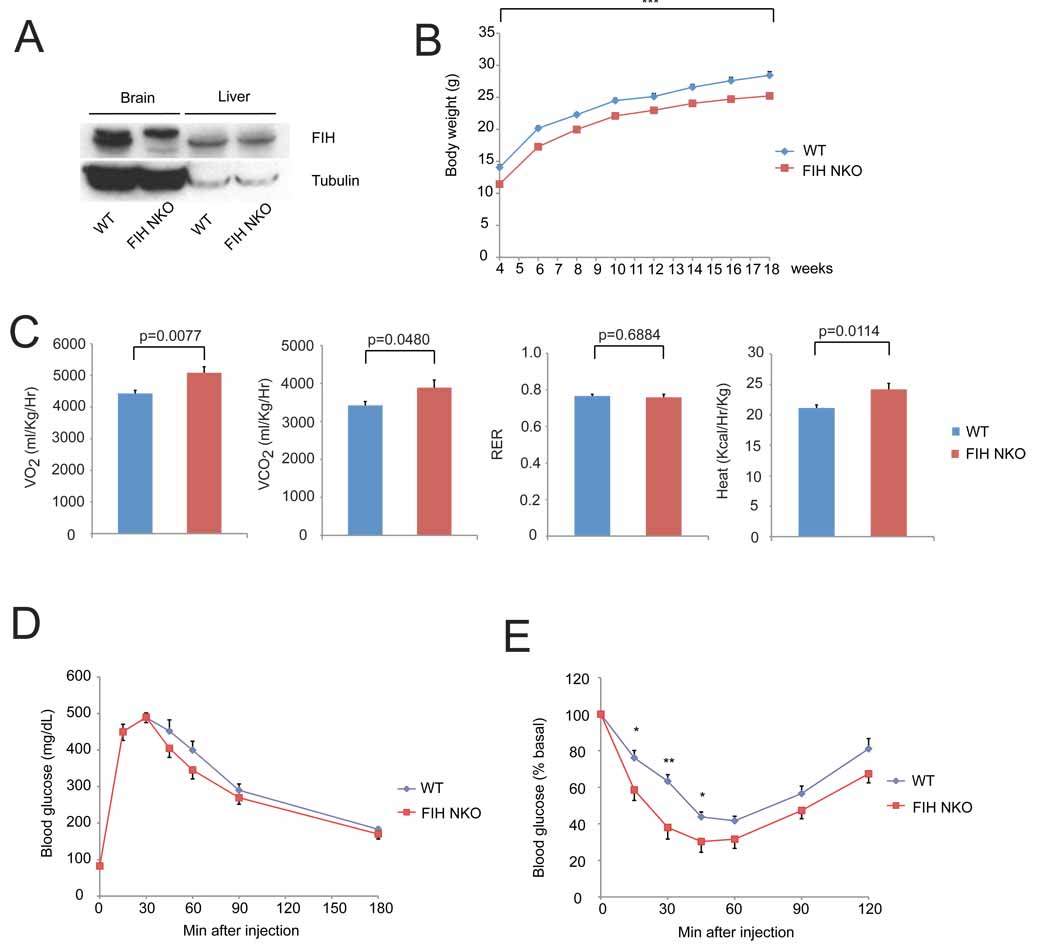
Immunoblot analysis of whole cell lysates of brain and liver samples from FIH neuron-specific knockout mice (FIH NKO) and WT mice using FIH and tubulin antibodies. The upper bands in brain samples are nonspecific.
Growth curves of FIH NKO (n=17) and their WT (n=15) littermates under normal chow. ***p<0.001.
Resting whole-body VO2, VCO2, RER and heat production in 2-month old WT (n=7) and FIH NKO (n=5) mice. Shown are the average value over 3 hr.
GTTs were measured for 18hr-fasting 2-month old WT (n=6) and FIH NKO (n=6) mice (2g D-glucose/kg body weight).
ITTs were performed on 4hr-fasting 2-month old WT (n=7) and FIH NKO (n=6) mice (0.75 U/kg body weight). *p<0.05, **p<0.01.
Values shown in graphs are expressed as mean ± SEM. p values are from Student’s t-test.
See also Figure S5 and Figure S6.
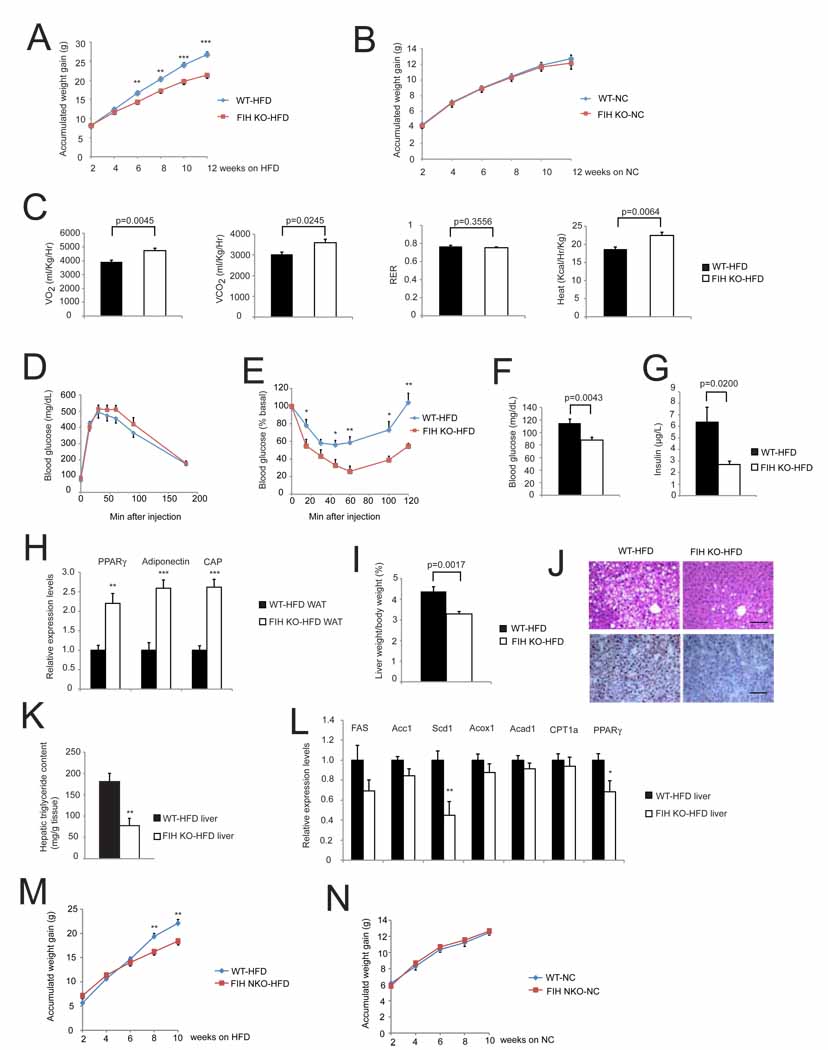
Accumulated weight gain of WT and KO mice fed with high fat diet (HFD) for 12-weeks. n=23 for WT mice. n=12 for FIH KO mice.**p<0.01. ***p<0.001.
Accumulated weight gain of WT and KO mice fed with NC for 12-weeks. n=16 for WT mice. n=12 for FIH KO mice.
Resting whole-body VO2, VCO2, RER and heat production in WT (n=6) and KO (n=8) fed with HFD for 12-weeks. Shown are the average value over 3 hr.
GTTs were measured for 18hr-fasting WT (n=9) and KO (n=7) mice fed with HFD for 12-weeks (2g D-glucose/kg body weight).
ITTs were performed on 4hr-fasting WT (n=7) and KO (n=5) mice fed with HFD for 12-weeks (1.0U/kg body weight). *p<0.05, **p<0.01.
Fasting blood glucose levels were measured on 18 hr-fasting WT (n=20) and KO (n=16) mice fed with HFD for 12-weeks.
Fed insulin levels were measured on WT and KO mice fed with HFD for 16-weeks. n=6/genotype.
Expression levels of genes encoding PPARγ, Adiponectin and CAP were increased in epididymal WAT of KO mice fed with HFD. n=6/genotype. **p<0.01. ***p<0.001.
Liver weight normalized with body weight from WT and KO mice fed with HFD. n=11–19/genotype.
(Top) Representative images of H&E stained liver sections from WT and KO mice fed with HFD. (Bottom) Representative images of Oil Red O- stained liver sections. The scale bar represents 100µm.
Hepatic triglyceride contents were measured in WT and FIH KO livers under HFD. n=6/genotype. **p<0.01.
Expression levels of genes encoding lipogenic enzymes (FAS, Acc1 and Scd1), those involved in β-oxidation (Acox1, Acad1 and CPT1a) and PPARγ in livers of WT and KO mice fed with HFD. n=6/genotype. *p<0.05. **p<0.01.
WAT and liver samples used in (H) to (L) were from mice fed with HFD for 16-weeks.
Accumulated weight gain of FIH neuronal KO (NKO) mice (n=6) and their WT littermates (n=11) fed with HFD for 10-weeks. **p<0.01.
Accumulated weight gain of FIH NKO (n=17) and their WT littermates (n=13) fed with NC for 10-weeks.
Values shown in graphs are expressed as mean ± SEM. p values are from Student’s t-test.
See also Figure S7, Table S3, and Table S4B.
References
-
- Aragones J, Schneider M, Van Geyte K, Fraisl P, Dresselaers T, Mazzone M, Dirkx R, Zacchigna S, Lemieux H, Jeoung NH, et al. Deficiency or inhibition of oxygen sensor Phd1 induces hypoxia tolerance by reprogramming basal metabolism. Nat Genet. 2008;40:170–180. - PubMed
-
- Aragonés J, Fraisl P, Baes M, Carmeliet P. Oxygen sensors at the crossroad of metabolism. Cell Metab. 2009;9:11–22. - PubMed
-
- Banerji B, Conejo-Garcia A, McNeill LA, McDonough MA, Buck MR, Hewitson KS, Oldham NJ, Schofield CJ. The inhibition of factor inhibiting hypoxia-inducible factor (FIH) by beta-oxocarboxylic acids. Chem Commun (Camb) 2005:5438–5440. - PubMed
MeSH terms
Substances
Associated data
- Actions
Grants and funding
LinkOut - more resources
Full Text Sources
Other Literature Sources
Molecular Biology Databases
Miscellaneous
