Review
. 2010 Oct 31;173(3):201-12.
doi: 10.1016/j.resp.2010.04.009. Epub 2010 Apr 23.

The role of CO(2) and central chemoreception in the control of breathing in the fetus and the neonate

Affiliations
Review

The role of CO(2) and central chemoreception in the control of breathing in the fetus and the neonate

Robert A Darnall. Respir Physiol Neurobiol. .

Abstract

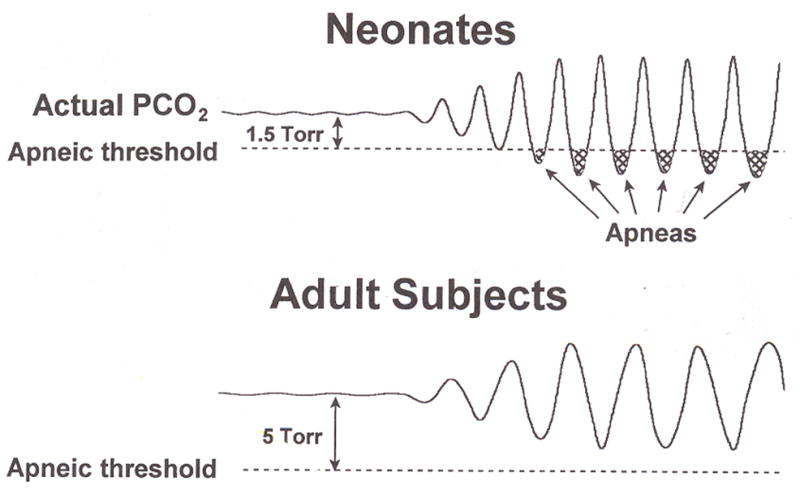
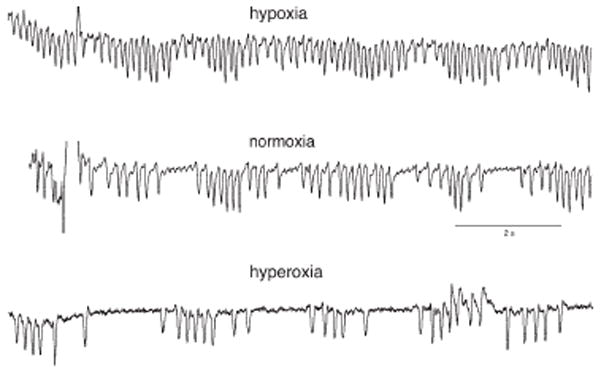
Central chemoreception is active early in development and likely drives fetal breathing movements, which are influenced by a combination of behavioral state and powerful inhibition. In the premature human infant and newborn rat ventilation increases in response to CO(2); in the rat the sensitivity of the response increases steadily after ∼P12. The premature human infant is more vulnerable to instability than the newborn rat and exhibits periodic breathing that is augmented by hypoxia and eliminated by breathing oxygen or CO(2) or the administration of respiratory stimulants. The sites of central chemoreception active in the fetus are not known, but may involve the parafacial respiratory group which may be a precursor to the adult RTN. The fetal and neonatal rat brainstem-spinal-cord preparations promise to provide important information about central chemoreception in the developing rodent and will increase our understanding of important clinical problems, including The Sudden Infant Death Syndrome, Congenital Central Hypoventilation Syndrome, and periodic breathing and apnea of prematurity.


Figures

Figure 1
Figure 1
Relationship between state related fetal breathing and level of tonic inhibition. The line alternating between HV ECoG and LV ECoG represents alternating combinations of excitation and inhibition that increase the probability of breathing during LV-ECoG and decrease the probability of breathing during HV-EcoG. The shaded box indicates a gradient of tonic inhibition from little or no inhibition (lighter) to heavy inhibition (darker). The boxes in the right side of the diagram indicate known sources of respiratory inhibition and excitation in the fetus. The three dashed lines represent examples of 1) a baseline level of inhibition that results in breathing only during LV-CoG, 2) heavy inhibition as might be encountered during hypoxia where there is no breathing in either state, and 3) little or no inhibition as might occur during cooling or at birth where breathing becomes continuous, occurring during both states.
Figure 2
Figure 2
The relationship between the percent of active sleep (AS) (short dashed line) and percent of irregular breathing (heavy dashed line) from 30 to 40 weeks postmenstrual age (PMA). Note that the percentage of quiet sleep (QS) steadily increases and the level of indeterminant sleep (IS) steadily decreases from 30 to 40 weeks PMA. The apparent increase in the percentage of AS that occurs from 30 to 36 weeks may be partially because AS cannot be scored with certainty and any sleep that is clearly not AS or QS is scored as IS. The sleep data is from Mirmiran, et al ((Mirmiran et al. 2003), and the irregular breathing data was taken from Parmelee, et all (Parmelee et al. 1972).
Figure 3
Figure 3
Periodic cycle duration is inversely related to postconceptional age. Periodic cycle duration is defined during periodic breathing as the interval from the beginning of one cluster of breaths to the beginning of the next cluster. The filled circles are data from full term infants and the open circles are from premature infants. Note that the developmentally younger infants, whether full term or premature have longer cycle durations. From Wilkinson, et al (Wilkinson et al. 2007).
Figure 4
Figure 4
The relationship between the proximity between eupneic PaCO2 and apneic threshold, oscillations in PaCO2, and apnea in neonates and adults. The upper panel represents the neonate where the eupnic PaCO2 is close to apneic threshold in contrast with the adult, shown in the lower panel where there is a greater difference between PaCO2 and apneic threshold. Note that similar levels of oscillation of PaCO2 results in frequent decreases below apneic threshold in the neonate resulting in the apnea associated with periodic breathing. From Rigatto (Rigatto 2003).
Figure 5
Figure 5
Periodic breathing in the Mecp2+/− Mouse during hypoxia, normoxia and hyperoxia. The experiment was performed by exposing the animal to 30 min of 40% oxygen, 12% oxygen, or room air. The upper panel illustrates a mostly regular breathing pattern during hypoxia. The middle and lower panels show periodicity associated with both normoxia and hyperoxia, respectively. From Bissonnette and Knopp (Bissonnette et al. 2008).
Figure 6
Figure 6
Change in the ventilatory response to CO2 with advancing age in the rat: a comparison of two methods. In one set of experiments (Stunden et al. 2001), the slope of the ΔV̇/Δ%CO2, normalized to body weight, for each animal was calculated using several levels of CO2 at different ages. Each grey symbol represents the slope from a single animal. In another set of experiments (Davis et al. 2006) the CO2 response was calculated as the % of eucapnic V̇E averaged from several breaths between 3–5 minutes of CO2 exposure. The open circles represent averages of measurements on several animals at different ages. Lines have been fitted to the data to demonstrate the trends. Values for the slope data is shown on the left axes and values for the % eucapnia data is shown on the right axis. The ranges have been aligned to approximate the two groups of data. Adapted from Stunden et al (Stunden et al. 2001) and Davis et al (Davis et al. 2006).
Figure 7
Figure 7
The effect of facial cooling on metabolic rate in a premature infant when abdominal temperature is kept constant. Infants were studied on a radiant warmer and facial cooling was accomplished by shading the face from the radiant heat. Note the steady increase in oxygen consumption with decreasing cheek temperature. Darnall, RA, 1978, unpublished observations.
Figure 8
Figure 8
Arousal habituation in response to repeated exposures either to 10% oxygen or 8% CO2 in the P15 rat pup. Each trial consisted of 3 minutes of either oxygen or CO2 followed by 6 minutes of room air. Each trial was started during a period of quiet immobility, most likely QS. Filled triangles represent data from hypoxia experiments and open triangles represent data from hypercapnia experiments. Note the progressive increase in the time to arousal (latency) for both. All studies were approved by the Dartmouth College Institutional Animal Care and Use Committee. Darnall, RA, unpublished observations.

References

    1. Abu-Shaweesh JM, Dreshaj IA, Thomas AJ, Haxhiu MA, Strohl KP, Martin RJ. Changes in respiratory timing induced by hypercapnia in maturing rats. J Appl Physiol. 1999;87:484–490. - PubMed
    1. Adamson SL, Kuipers IM, Olson DM. Umbilical cord occlusion stimulates breathing independent of blood gases and pH. J Appl Physiol. 1991;70:1796–1809. - PubMed
    1. Aizenfisz S, Dauger S, Durand E, Vardon G, Levacher B, Simonneau M, Pachnis V, Gaultier C, Gallego J. Ventilatory responses to hypercapnia and hypoxia in heterozygous c-ret newborn mice. Resp Physiol & Neurobiol. 2002;131:213–222. - PubMed
    1. Albersheim S, Boychuk R, Seshia MM, Cates D, Rigatto H. Effects of CO2 on immediate ventilatory response to O2 in preterm infants. J Appl Physiol. 1976;41:609–611. - PubMed
    1. Alvarez JE, Bodani J, Fajardo CA, Kwiatkowski K, Cates DB, Rigatto H. Sighs and their relationship to apnea in the newborn infant. Biol Neon. 1993;63:139–146. - PubMed

Publication types