

Integrity of the prolyl hydroxylase domain protein 2:erythropoietin pathway in aging mice
- PMID: 20400342
- PMCID: PMC2878925
- DOI: 10.1016/j.bcmd.2010.03.003
Integrity of the prolyl hydroxylase domain protein 2:erythropoietin pathway in aging mice
Abstract
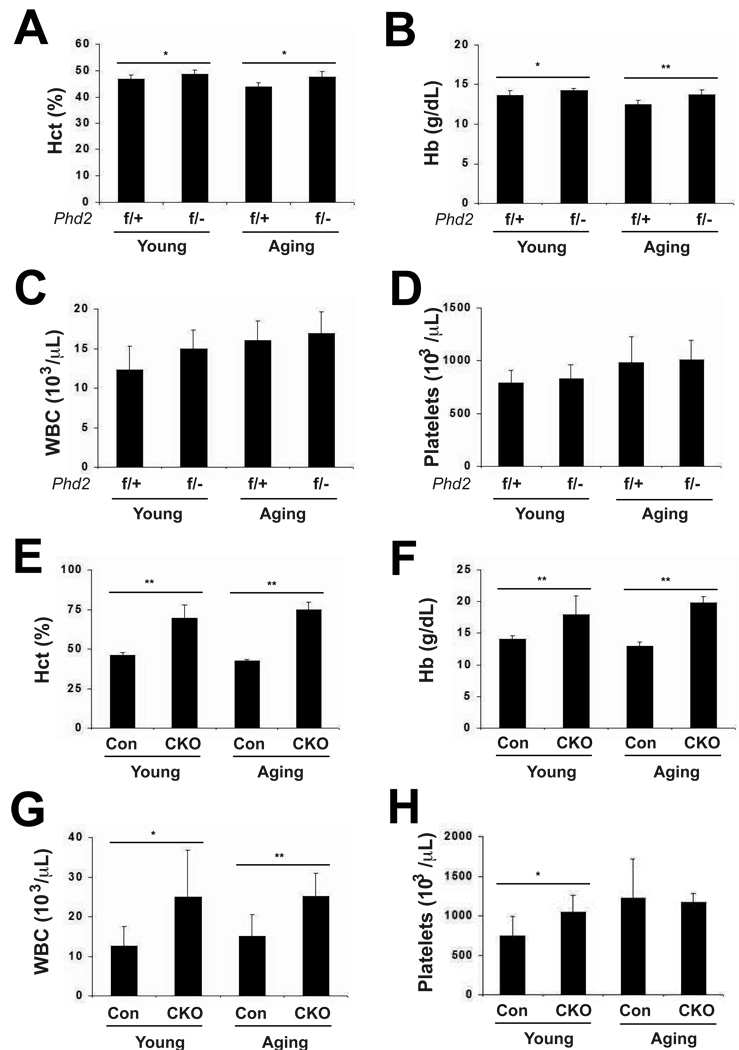
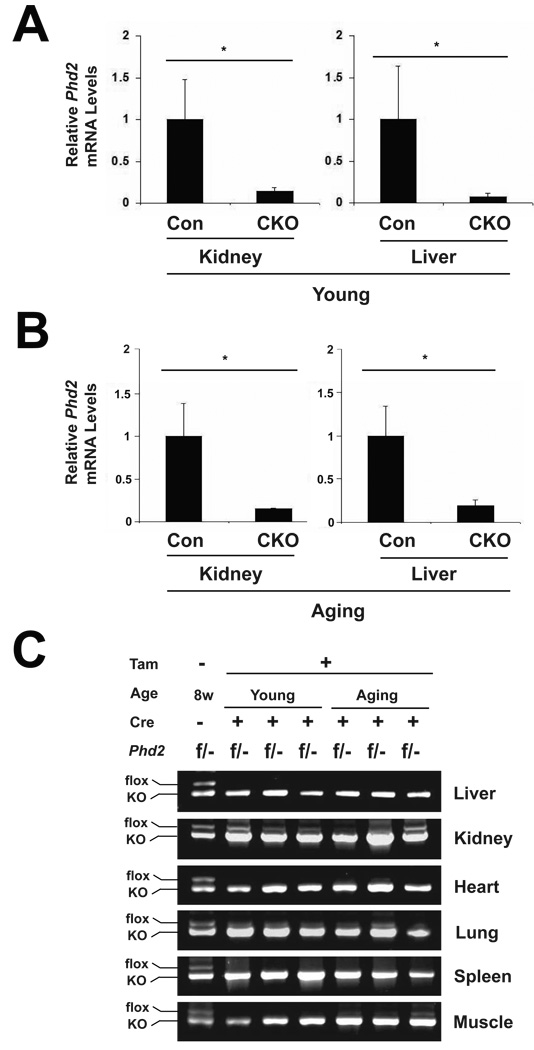
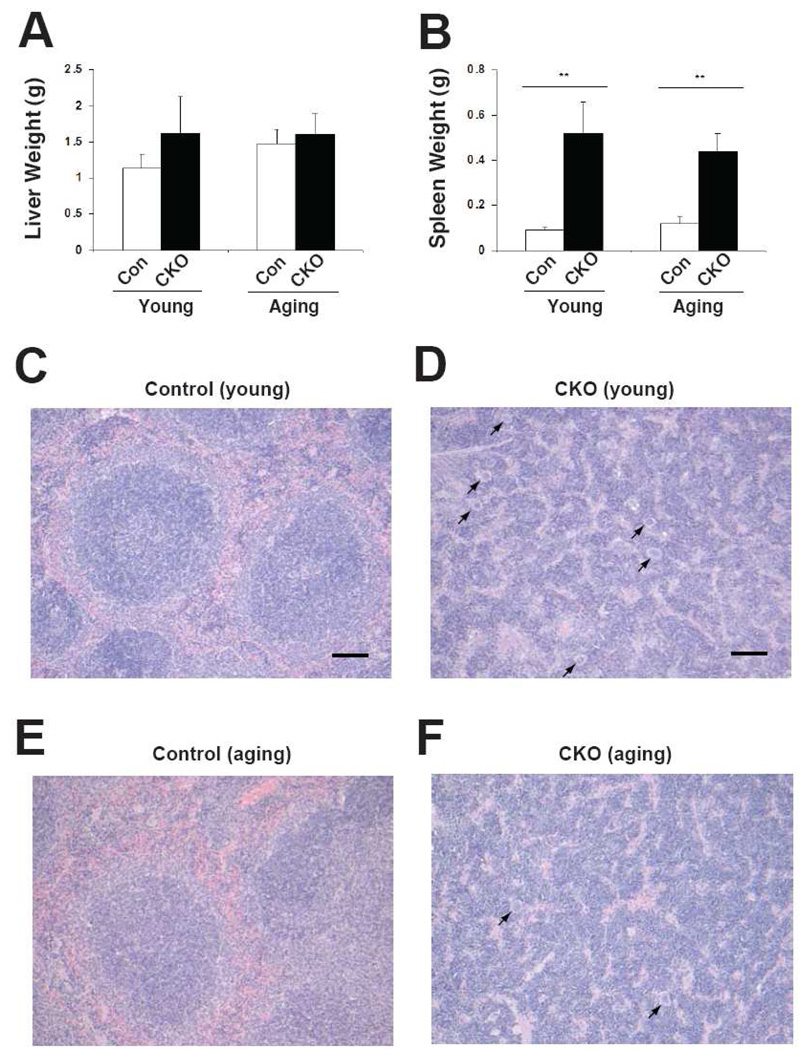
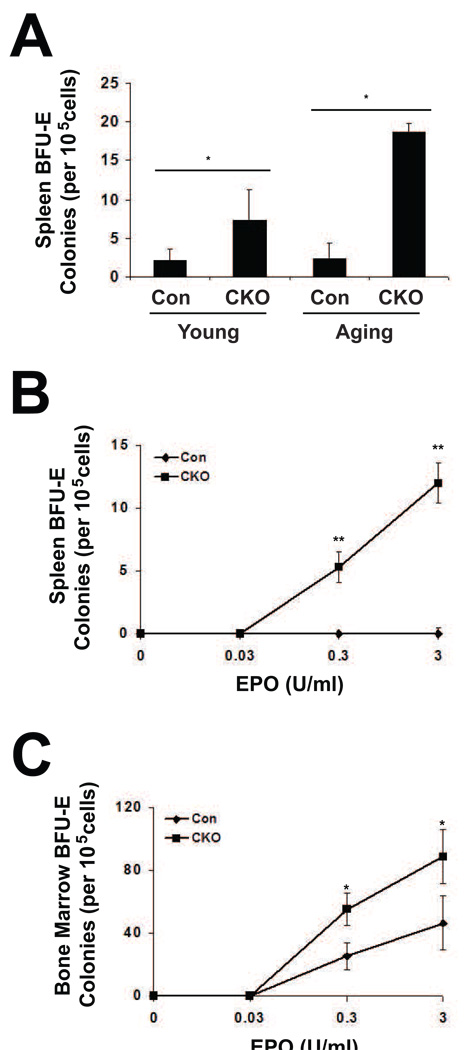
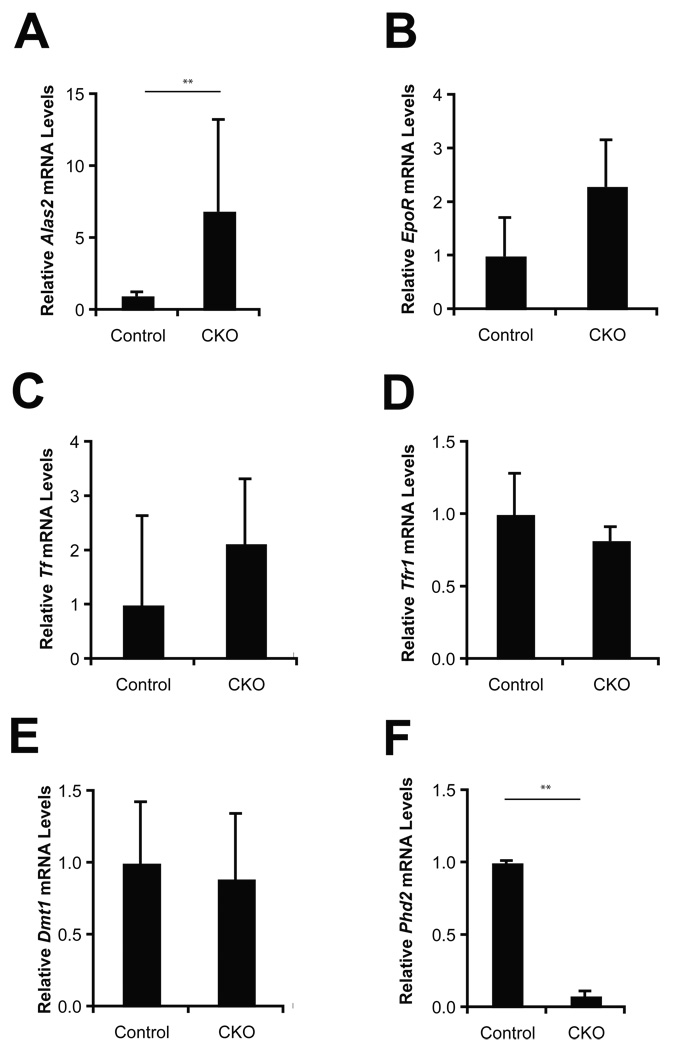
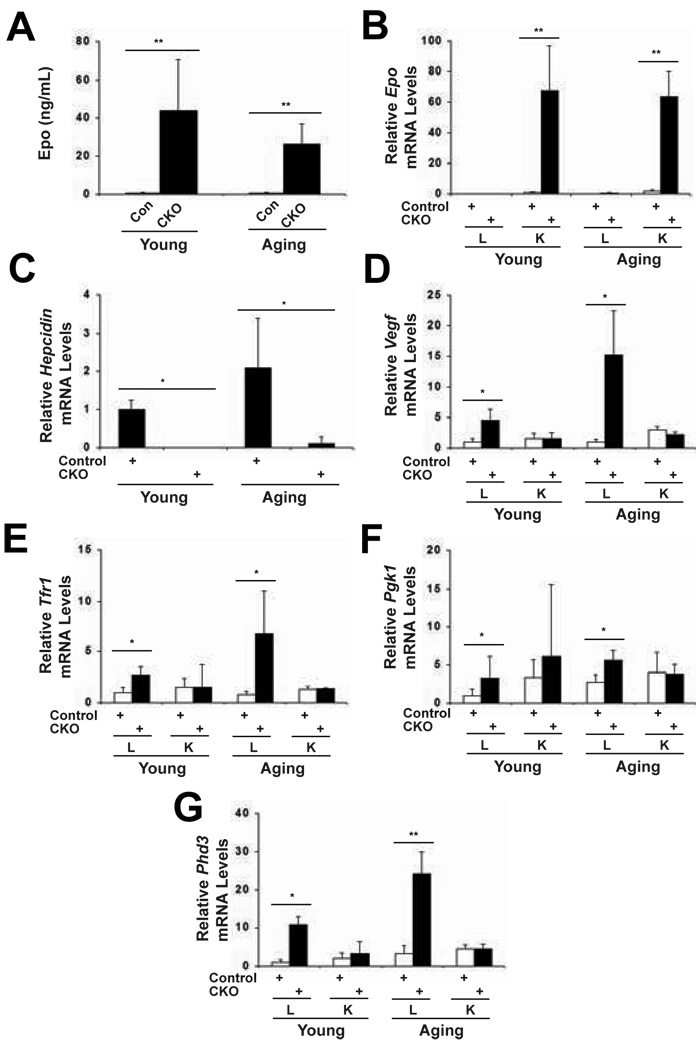
The central transcriptional response to hypoxia is mediated by the prolyl hydroxylase domain protein (PHD):hypoxia inducible factor (HIF) pathway. In this pathway, PHD prolyl hydroxylates and thereby negatively regulates the alpha-subunit of the transcription factor HIF (HIF-alpha). An important HIF target gene is that for erythropoietin (EPO), which controls red cell mass. Recent studies have identified PHD2 as the critical PHD isoform regulating the EPO gene. Other studies have shown that the inducibility of the HIF pathway diminishes as a function of age. Thus, an important question is whether the PHD2:EPO pathway is altered in the aging. Here, we employed a mouse line with a globally-inducible Phd2 conditional knockout allele to examine the integrity of the Phd2:Epo axis in young (six to eight months old) and aging (sixteen to twenty months old) mice. We find that acute global deletion of Phd2 results in a robust erythrocytosis in both young and aging mice, with both age groups showing marked extramedullary hematopoiesis in the spleen. Epo mRNA is dramatically upregulated in the kidney, but not in the liver, in both age groups. Conversely, other Hif targets, including Vegf, Pgk1, and Phd3 are upregulated in the liver but not in the kidney in both age groups. These findings have implications for targeting this pathway in the aging.
Copyright 2010 Elsevier Inc. All rights reserved.
Figures
Similar articles
-
Regulation of adult erythropoiesis by prolyl hydroxylase domain proteins.Blood. 2008 Mar 15;111(6):3229-35. doi: 10.1182/blood-2007-09-114561. Epub 2007 Dec 4. Blood. 2008. PMID: 18056838 Free PMC article.
-
HIF-1α is a protective factor in conditional PHD2-deficient mice suffering from severe HIF-2α-induced excessive erythropoiesis.Blood. 2013 Feb 21;121(8):1436-45. doi: 10.1182/blood-2012-08-449181. Epub 2012 Dec 20. Blood. 2013. PMID: 23264599 Free PMC article.
-
Prolyl-4-hydroxylases 2 and 3 control erythropoietin production in renin-expressing cells of mouse kidneys.J Physiol. 2022 Feb;600(3):671-694. doi: 10.1113/JP282615. Epub 2021 Dec 27. J Physiol. 2022. PMID: 34863041
-
The HIF pathway and erythrocytosis.Annu Rev Pathol. 2011;6:165-92. doi: 10.1146/annurev-pathol-011110-130321. Annu Rev Pathol. 2011. PMID: 20939709 Review.
-
Hypoxia-induced erythropoietin production: a paradigm for oxygen-regulated gene expression.Clin Exp Pharmacol Physiol. 2006 Oct;33(10):968-79. doi: 10.1111/j.1440-1681.2006.04474.x. Clin Exp Pharmacol Physiol. 2006. PMID: 17002676 Review.
Cited by
-
The Zinc Finger of Prolyl Hydroxylase Domain Protein 2 Is Essential for Efficient Hydroxylation of Hypoxia-Inducible Factor α.Mol Cell Biol. 2016 Aug 26;36(18):2328-43. doi: 10.1128/MCB.00090-16. Print 2016 Sep 15. Mol Cell Biol. 2016. PMID: 27325674 Free PMC article.
-
Mouse knock-out of IOP1 protein reveals its essential role in mammalian cytosolic iron-sulfur protein biogenesis.J Biol Chem. 2011 May 6;286(18):15797-805. doi: 10.1074/jbc.M110.201731. Epub 2011 Mar 2. J Biol Chem. 2011. PMID: 21367862 Free PMC article.
-
A knock-in mouse model of human PHD2 gene-associated erythrocytosis establishes a haploinsufficiency mechanism.J Biol Chem. 2013 Nov 22;288(47):33571-33584. doi: 10.1074/jbc.M113.482364. Epub 2013 Oct 11. J Biol Chem. 2013. PMID: 24121508 Free PMC article.
-
Hypoxia-induced angiogenesis is delayed in aging mouse brain.Brain Res. 2011 May 10;1389:50-60. doi: 10.1016/j.brainres.2011.03.016. Epub 2011 Mar 12. Brain Res. 2011. PMID: 21402058 Free PMC article.
-
Prolyl hydroxylase domain enzymes: important regulators of cancer metabolism.Hypoxia (Auckl). 2014 Aug 30;2:127-142. doi: 10.2147/HP.S47968. eCollection 2014. Hypoxia (Auckl). 2014. PMID: 27774472 Free PMC article. Review.
References
-
- Semenza GL. Life with oxygen. Science. 2007;318:62–64. - PubMed
-
- Schofield CJ, Ratcliffe PJ. Oxygen sensing by HIF hydroxylases. Nat Rev Mol Cell Biol. 2004;5:343–354. - PubMed
-
- Kaelin WG. Von hippel-lindau disease. Annu Rev Pathol. 2007;2:145–173. - PubMed
-
- Kaelin WG. Proline hydroxylation and gene expression. Annu Rev Biochem. 2005;74:115–128. - PubMed
Publication types
MeSH terms
Substances
Grants and funding
LinkOut - more resources
Full Text Sources
Medical
Research Materials
Miscellaneous
