

Extended anti-inflammatory action of a degradation-resistant mutant of cell-penetrating suppressor of cytokine signaling 3
- PMID: 20400504
- PMCID: PMC2881796
- DOI: 10.1074/jbc.M109.095216
Extended anti-inflammatory action of a degradation-resistant mutant of cell-penetrating suppressor of cytokine signaling 3
Abstract
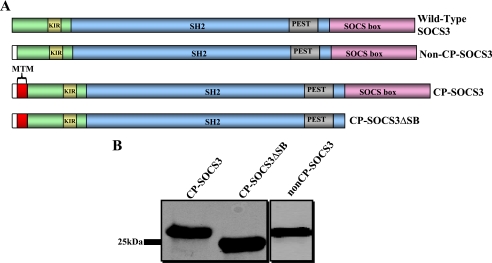
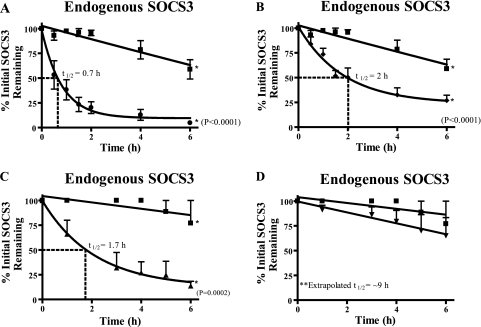
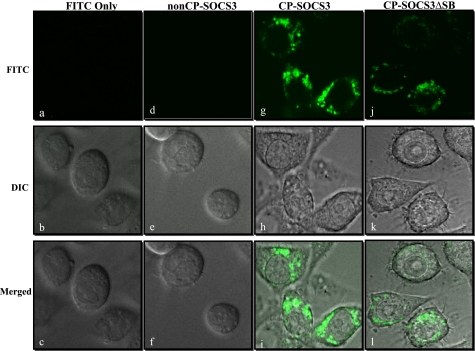
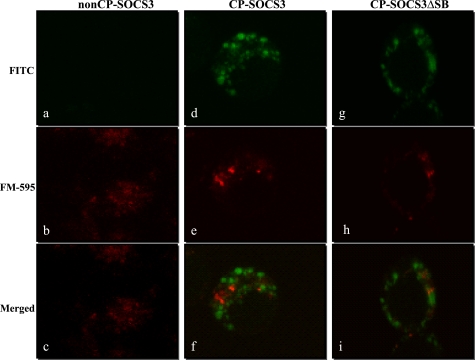
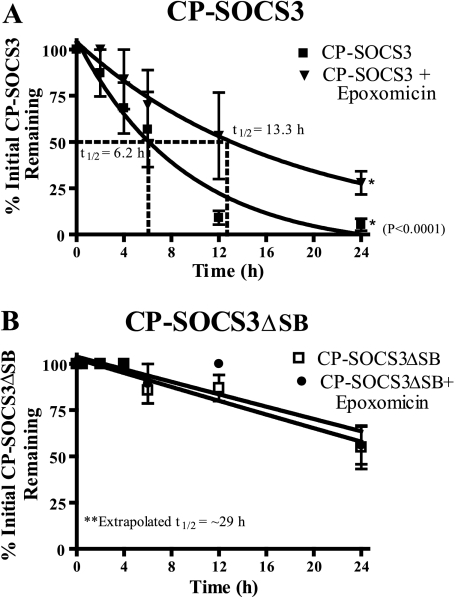
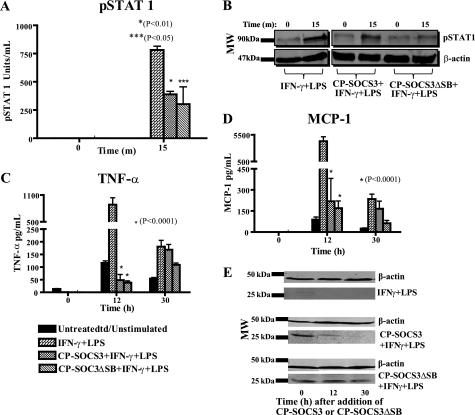
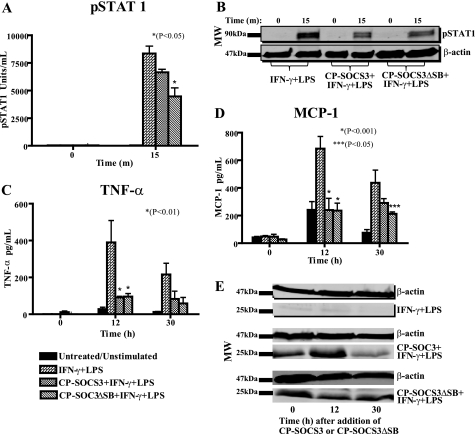
Suppressor of cytokine signaling 3 (SOCS3) regulates the proinflammatory cytokine signaling mediated by the JAK/STAT signaling pathway. SOCS3 is rapidly induced and then targeted to the ubiquitin-proteasome pathway via a mechanism that requires the C-terminal SOCS box. Due to its rapid turnover, the intracellular stores of SOCS3 seem insufficient to control acute or protracted inflammatory diseases. Previously, we developed an intracellular protein therapy that uses a recombinant cell-penetrating form of SOCS3 (CP-SOCS3) to inhibit the JAK/STAT pathway and prevent cytokine-mediated lethal inflammation and apoptosis of the liver (Jo, D., Liu, D., Yao, S., Collins, R. D., and Hawiger, J. (2005) Nat. Med. 11, 892-898). The potent anti-inflammatory and cytoprotective activity of CP-SOCS3 prompted us to analyze its intracellular turnover, as compared with that of endogenous SOCS3 protein induced in macrophages by the proinflammatory agonists, interferon-gamma and lipopolysaccharide. We found that the half-life (t(1/2)) of endogenous SOCS3 is 0.7 h in activated macrophages, compared with a t(1/2) of 6.2 h for recombinant CP-SOCS3. Deletion of the SOCS box in CP-SOCS3 renders it more resistant to proteasomal degradation, extending its t(1/2) to 29 h. Consequently, this SOCS box-deleted form of CP-SOCS3 displays persistent inhibitory activity for 24 h toward interferon-gamma- and lipopolysaccharide-induced cytokine and chemokine production. Compared with the wild-type suppressor, this gain-of-function CP-SOCS3 mutant provides a longer acting inhibitor of cytokine signaling, a feature that offers a clear advantage for the intracellular delivery of proteins to treat acute or protracted inflammatory diseases.
Figures
Similar articles
-
Intracellular protein therapy with SOCS3 inhibits inflammation and apoptosis.Nat Med. 2005 Aug;11(8):892-8. doi: 10.1038/nm1269. Epub 2005 Jul 10. Nat Med. 2005. PMID: 16007096
-
Deletion of the SOCS box of suppressor of cytokine signaling 3 (SOCS3) in embryonic stem cells reveals SOCS box-dependent regulation of JAK but not STAT phosphorylation.Cell Signal. 2009 Mar;21(3):394-404. doi: 10.1016/j.cellsig.2008.11.002. Epub 2008 Nov 12. Cell Signal. 2009. PMID: 19056487 Free PMC article.
-
Signal transducer and activator of transcription-3/suppressor of cytokine signaling-3 (STAT3/SOCS3) axis in myeloid cells regulates neuroinflammation.Proc Natl Acad Sci U S A. 2012 Mar 27;109(13):5004-9. doi: 10.1073/pnas.1117218109. Epub 2012 Mar 12. Proc Natl Acad Sci U S A. 2012. PMID: 22411837 Free PMC article.
-
The biology and mechanism of action of suppressor of cytokine signaling 3.Growth Factors. 2012 Aug;30(4):207-19. doi: 10.3109/08977194.2012.687375. Epub 2012 May 11. Growth Factors. 2012. PMID: 22574771 Free PMC article. Review.
-
SOCS proteins: negative regulators of cytokine signaling.Stem Cells. 2001;19(5):378-87. doi: 10.1634/stemcells.19-5-378. Stem Cells. 2001. PMID: 11553846 Review.
Cited by
-
SOCS3 revisited: a broad regulator of disease, now ready for therapeutic use?Cell Mol Life Sci. 2016 Sep;73(17):3323-36. doi: 10.1007/s00018-016-2234-x. Epub 2016 May 2. Cell Mol Life Sci. 2016. PMID: 27137184 Free PMC article. Review.
-
SOCS3, a Major Regulator of Infection and Inflammation.Front Immunol. 2014 Feb 19;5:58. doi: 10.3389/fimmu.2014.00058. eCollection 2014. Front Immunol. 2014. PMID: 24600449 Free PMC article. Review.
-
Role of Ubiquitylation in Controlling Suppressor of Cytokine Signalling 3 (SOCS3) Function and Expression.Cells. 2014 May 30;3(2):546-62. doi: 10.3390/cells3020546. Cells. 2014. PMID: 24886706 Free PMC article.
-
Nuclear transport modulation reduces hypercholesterolemia, atherosclerosis, and fatty liver.J Am Heart Assoc. 2013 Apr 5;2(2):e000093. doi: 10.1161/JAHA.113.000093. J Am Heart Assoc. 2013. PMID: 23563994 Free PMC article.
-
Socs3b regulates the development and function of innate immune cells in zebrafish.Front Immunol. 2023 Mar 8;14:1119727. doi: 10.3389/fimmu.2023.1119727. eCollection 2023. Front Immunol. 2023. PMID: 36969252 Free PMC article.
References
-
- Hawiger J. (2001) Immunol. Res. 23, 99–109 - PubMed
-
- Dinarello C. A. (2000) Chest 118, 503–508 - PubMed
-
- Opal S. M., DePalo V. A. (2000) Chest 117, 1162–1172 - PubMed
-
- Alexander W. S., Hilton D. J. (2004) Annu. Rev. Immunol. 22, 503–529 - PubMed
-
- Liew F. Y., Xu D., Brint E. K., O'Neill L. A. (2005) Nat. Rev. Immunol. 5, 446–458 - PubMed
Publication types
MeSH terms
Substances
Grants and funding
- P60 DK020593/DK/NIDDK NIH HHS/United States
- HL069452/HL/NHLBI NIH HHS/United States
- P30 DK058404/DK/NIDDK NIH HHS/United States
- P30 HD015052/HD/NICHD NIH HHS/United States
- R01 HL069452/HL/NHLBI NIH HHS/United States
- T32 AI007281/AI/NIAID NIH HHS/United States
- P30 EY008126/EY/NEI NIH HHS/United States
- P30 DK020593/DK/NIDDK NIH HHS/United States
- P30 CA068485/CA/NCI NIH HHS/United States
- U24 DK059637/DK/NIDDK NIH HHS/United States
- AA015752/AA/NIAAA NIH HHS/United States
- T32 HL069765/HL/NHLBI NIH HHS/United States
- F31-GM077030/GM/NIGMS NIH HHS/United States
- R01 AA015752/AA/NIAAA NIH HHS/United States
LinkOut - more resources
Full Text Sources
Other Literature Sources
Miscellaneous
