Epileptic high-frequency network activity in a model of non-lesional temporal lobe epilepsy
- PMID: 20400525
- PMCID: PMC2859153
- DOI: 10.1093/brain/awq070
Epileptic high-frequency network activity in a model of non-lesional temporal lobe epilepsy
Abstract
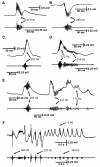
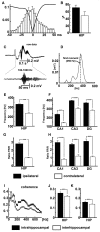
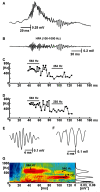
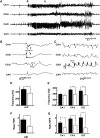
High-frequency cortical activity, particularly in the 250-600 Hz (fast ripple) band, has been implicated in playing a crucial role in epileptogenesis and seizure generation. Fast ripples are highly specific for the seizure initiation zone. However, evidence for the association of fast ripples with epileptic foci depends on animal models and human cases with substantial lesions in the form of hippocampal sclerosis, which suggests that neuronal loss may be required for fast ripples. In the present work, we tested whether cell loss is a necessary prerequisite for the generation of fast ripples, using a non-lesional model of temporal lobe epilepsy that lacks hippocampal sclerosis. The model is induced by unilateral intrahippocampal injection of tetanus toxin. Recordings from the hippocampi of freely-moving epileptic rats revealed high-frequency activity (>100 Hz), including fast ripples. High-frequency activity was present both during interictal discharges and seizure onset. Interictal fast ripples proved a significantly more reliable marker of the primary epileptogenic zone than the presence of either interictal discharges or ripples (100-250 Hz). These results suggest that fast ripple activity should be considered for its potential value in the pre-surgical workup of non-lesional temporal lobe epilepsy.
Figures


Similar articles
-
High-frequency (80-500 Hz) oscillations and epileptogenesis in temporal lobe epilepsy.Neurobiol Dis. 2011 Jun;42(3):231-41. doi: 10.1016/j.nbd.2011.01.007. Epub 2011 Jan 14. Neurobiol Dis. 2011. PMID: 21238589 Free PMC article.
-
Hippocampal high frequency oscillations in unilateral and bilateral mesial temporal lobe epilepsy.Clin Neurophysiol. 2019 Jul;130(7):1151-1159. doi: 10.1016/j.clinph.2019.03.026. Epub 2019 Apr 10. Clin Neurophysiol. 2019. PMID: 31100580
-
Interictal high-frequency oscillations (80-500 Hz) in the human epileptic brain: entorhinal cortex.Ann Neurol. 2002 Oct;52(4):407-15. doi: 10.1002/ana.10291. Ann Neurol. 2002. PMID: 12325068
-
High-frequency oscillations and mesial temporal lobe epilepsy.Neurosci Lett. 2018 Feb 22;667:66-74. doi: 10.1016/j.neulet.2017.01.047. Epub 2017 Jan 20. Neurosci Lett. 2018. PMID: 28115239 Review.
-
Mechanisms of epileptiform synchronization in cortical neuronal networks.Curr Med Chem. 2014;21(6):653-62. doi: 10.2174/0929867320666131119151136. Curr Med Chem. 2014. PMID: 24251567 Free PMC article. Review.
Cited by
-
Nonictal EEG biomarkers for diagnosis and treatment.Epilepsia Open. 2018 Sep 17;3(Suppl Suppl 2):120-126. doi: 10.1002/epi4.12233. eCollection 2018 Dec. Epilepsia Open. 2018. PMID: 30564770 Free PMC article.
-
Unit firing and oscillations at seizure onset in epileptic rodents.Neurobiol Dis. 2019 Jul;127:382-389. doi: 10.1016/j.nbd.2019.03.027. Epub 2019 Mar 27. Neurobiol Dis. 2019. PMID: 30928646 Free PMC article. Review.
-
Update on the mechanisms and roles of high-frequency oscillations in seizures and epileptic disorders.Epilepsia. 2017 Aug;58(8):1330-1339. doi: 10.1111/epi.13830. Epub 2017 Jul 6. Epilepsia. 2017. PMID: 28681378 Free PMC article. Review.
-
Structural and functional substrates of tetanus toxin in an animal model of temporal lobe epilepsy.Brain Struct Funct. 2015 Mar;220(2):1013-29. doi: 10.1007/s00429-013-0697-1. Epub 2014 Jan 18. Brain Struct Funct. 2015. PMID: 24442865 Free PMC article.
-
Semiology, clustering, periodicity and natural history of seizures in an experimental occipital cortical epilepsy model.Dis Model Mech. 2018 Dec 14;11(12):dmm036194. doi: 10.1242/dmm.036194. Dis Model Mech. 2018. PMID: 30467223 Free PMC article.
References
-
- Allen PJ, Fish DR, Smith SJ. Very high-frequency rhythmic activity during SEEG suppression in frontal lobe epilepsy. Electroencephalogr Clin Neurophysiol. 1992;82:155–9. - PubMed
-
- Axmacher N, Mormann F, Fernandez G, Elger CE, Fell J. Memory formation by neuronal synchronization. Brain Res Rev. 2006;52:170–82. - PubMed
-
- Bikson M, Fox JE, Jefferys JGR. Neuronal aggregate formation underlies spatiotemporal dynamics of nonsynaptic seizure initiation. J Neurophysiol. 2003;89:2330–3. - PubMed
-
- Bragin A, Azizyan A, Almajano J, Wilson CL, Engel J., Jr Analysis of chronic seizure onsets after intrahippocampal kainic acid injection in freely moving rats. Epilepsia. 2005;46:1592–8. - PubMed
Publication types
MeSH terms
Substances
Grants and funding
LinkOut - more resources
Full Text Sources
Other Literature Sources

