

Comparative transcriptome and secretome analysis of wood decay fungi Postia placenta and Phanerochaete chrysosporium
- PMID: 20400566
- PMCID: PMC2876446
- DOI: 10.1128/AEM.00058-10
Comparative transcriptome and secretome analysis of wood decay fungi Postia placenta and Phanerochaete chrysosporium
Abstract
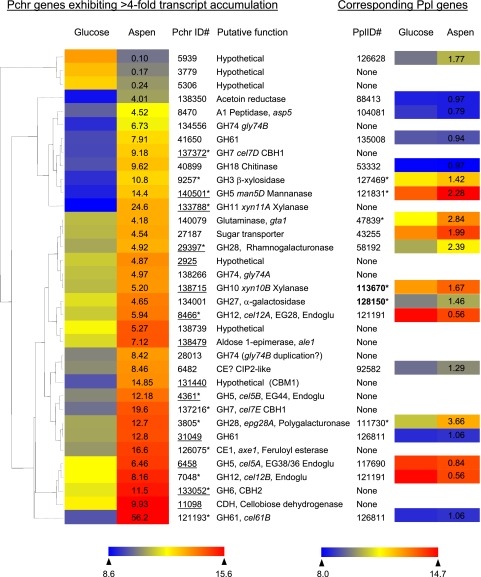
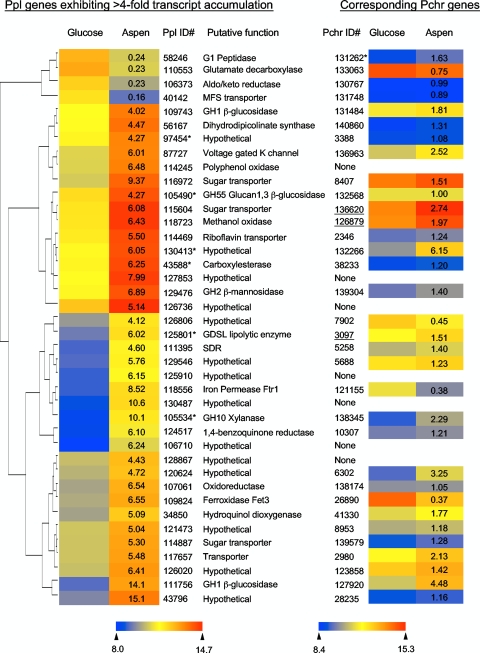
Cellulose degradation by brown rot fungi, such as Postia placenta, is poorly understood relative to the phylogenetically related white rot basidiomycete, Phanerochaete chrysosporium. To elucidate the number, structure, and regulation of genes involved in lignocellulosic cell wall attack, secretome and transcriptome analyses were performed on both wood decay fungi cultured for 5 days in media containing ball-milled aspen or glucose as the sole carbon source. Using liquid chromatography-tandem mass spectrometry (LC-MS/MS), a total of 67 and 79 proteins were identified in the extracellular fluids of P. placenta and P. chrysosporium cultures, respectively. Viewed together with transcript profiles, P. chrysosporium employs an array of extracellular glycosyl hydrolases to simultaneously attack cellulose and hemicelluloses. In contrast, under these same conditions, P. placenta secretes an array of hemicellulases but few potential cellulases. The two species display distinct expression patterns for oxidoreductase-encoding genes. In P. placenta, these patterns are consistent with an extracellular Fenton system and include the upregulation of genes involved in iron acquisition, in the synthesis of low-molecular-weight quinones, and possibly in redox cycling reactions.
Figures
Similar articles
-
Significant alteration of gene expression in wood decay fungi Postia placenta and Phanerochaete chrysosporium by plant species.Appl Environ Microbiol. 2011 Jul;77(13):4499-507. doi: 10.1128/AEM.00508-11. Epub 2011 May 6. Appl Environ Microbiol. 2011. PMID: 21551287 Free PMC article.
-
Genome, transcriptome, and secretome analysis of wood decay fungus Postia placenta supports unique mechanisms of lignocellulose conversion.Proc Natl Acad Sci U S A. 2009 Feb 10;106(6):1954-9. doi: 10.1073/pnas.0809575106. Epub 2009 Feb 4. Proc Natl Acad Sci U S A. 2009. PMID: 19193860 Free PMC article.
-
Role of carbon source in the shift from oxidative to hydrolytic wood decomposition by Postia placenta.Fungal Genet Biol. 2017 Sep;106:1-8. doi: 10.1016/j.fgb.2017.06.003. Epub 2017 Jun 27. Fungal Genet Biol. 2017. PMID: 28666924
-
Extracellular oxidative systems of the lignin-degrading Basidiomycete Phanerochaete chrysosporium.Fungal Genet Biol. 2007 Feb;44(2):77-87. doi: 10.1016/j.fgb.2006.07.007. Epub 2006 Sep 12. Fungal Genet Biol. 2007. PMID: 16971147 Review.
-
The fungal glutathione S-transferase system. Evidence of new classes in the wood-degrading basidiomycete Phanerochaete chrysosporium.Cell Mol Life Sci. 2009 Dec;66(23):3711-25. doi: 10.1007/s00018-009-0104-5. Epub 2009 Aug 7. Cell Mol Life Sci. 2009. PMID: 19662500 Free PMC article. Review.
Cited by
-
Properties, Physiological Functions and Involvement of Basidiomycetous Alcohol Oxidase in Wood Degradation.Int J Mol Sci. 2022 Nov 9;23(22):13808. doi: 10.3390/ijms232213808. Int J Mol Sci. 2022. PMID: 36430286 Free PMC article. Review.
-
Short-read sequencing for genomic analysis of the brown rot fungus Fibroporia radiculosa.Appl Environ Microbiol. 2012 Apr;78(7):2272-81. doi: 10.1128/AEM.06745-11. Epub 2012 Jan 13. Appl Environ Microbiol. 2012. PMID: 22247176 Free PMC article.
-
RNA Sequencing Reveals Differential Gene Expression of Cerrena Unicolor in Response to Variable Lighting Conditions.Int J Mol Sci. 2019 Jan 12;20(2):290. doi: 10.3390/ijms20020290. Int J Mol Sci. 2019. PMID: 30642073 Free PMC article.
-
Analysis of the Phlebiopsis gigantea genome, transcriptome and secretome provides insight into its pioneer colonization strategies of wood.PLoS Genet. 2014 Dec 4;10(12):e1004759. doi: 10.1371/journal.pgen.1004759. eCollection 2014 Dec. PLoS Genet. 2014. PMID: 25474575 Free PMC article.
-
The Cultivation Method Affects the Transcriptomic Response of Aspergillus niger to Growth on Sugar Beet Pulp.Microbiol Spectr. 2021 Sep 3;9(1):e0106421. doi: 10.1128/Spectrum.01064-21. Epub 2021 Aug 25. Microbiol Spectr. 2021. PMID: 34431718 Free PMC article.
References
-
- Abbas, A., H. Koc, F. Liu, and M. Tien. 2004. Fungal degradation of wood: initial proteomic analysis of extracellular proteins of Phanerochaete chrysosporium grown on oak substrate. Curr. Genet. 47:49-56. - PubMed
-
- Baldrian, P., and V. Valaskova. 2008. Degradation of cellulose by basidiomycetous fungi. FEMS Microbiol. Rev. 32:501-521. - PubMed
-
- Bao, W., E. Lymar, and V. Renganathan. 1994. Optimization of cellobiose dehydrogenase and β-glucosidase production by cellulose-degrading cultures of Phanerochaete chrysosporium. Appl. Biochem. Biotechnol. 42:642-646.
-
- Benjamini, Y., and Y. Hochberg. 1995. Controlling the false discovery rate: a practical and powerful approach to multiple testing. J. R. Stat. Soc. B 57:289-300.
-
- Binder, M., D. Hibbett, K. H. Larsson, E. Larsson, and E. Langer. 2005. The phylogenetic distribution of resupinate forms in the homobasidiomycetes. Syst. Biodivers. 3:113-157.
Publication types
MeSH terms
Substances
LinkOut - more resources
Full Text Sources
Other Literature Sources
Molecular Biology Databases
