. 2010 May 7;55(9):2761-88.
doi: 10.1088/0031-9155/55/9/022. Epub 2010 Apr 19.

Design study of a high-resolution breast-dedicated PET system built from cadmium zinc telluride detectors

Affiliations

Design study of a high-resolution breast-dedicated PET system built from cadmium zinc telluride detectors

Hao Peng et al. Phys Med Biol. .

Abstract

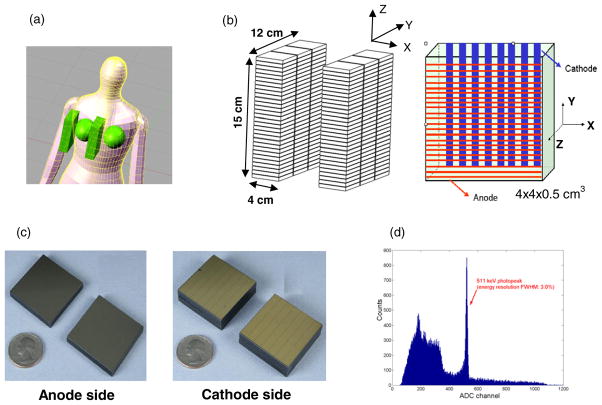
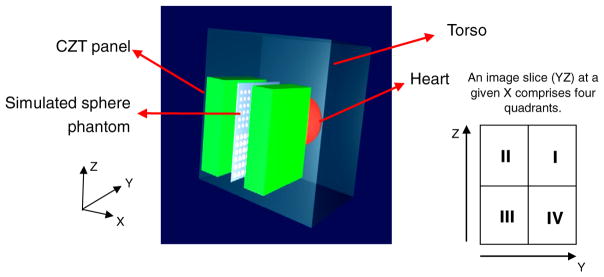
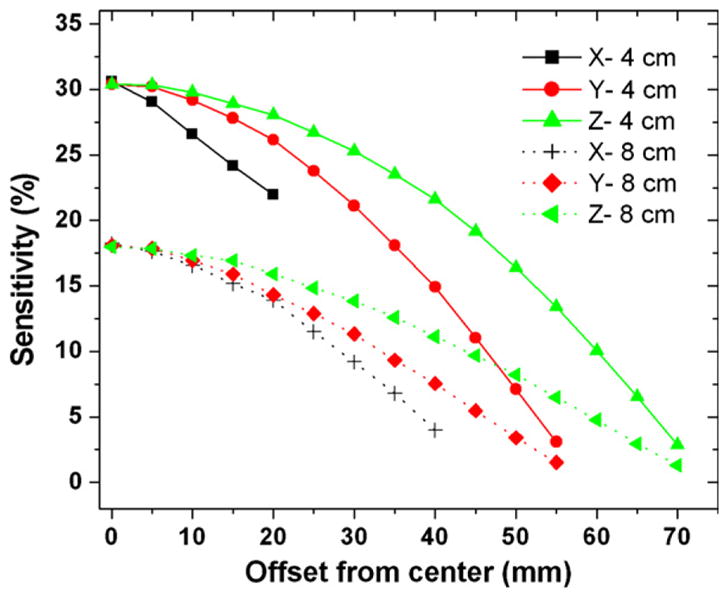
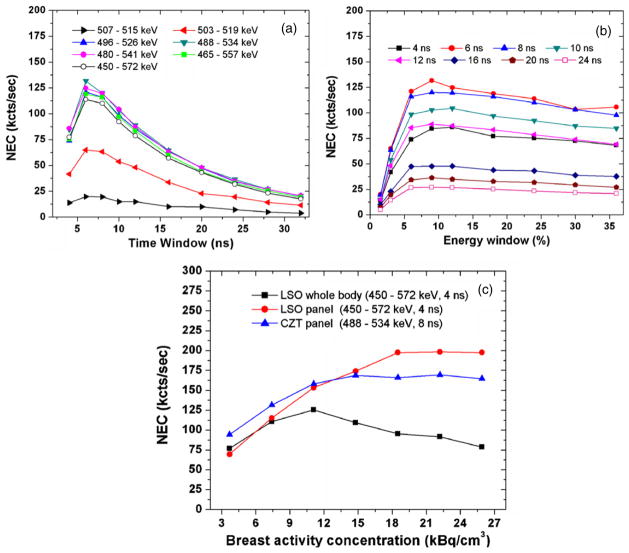
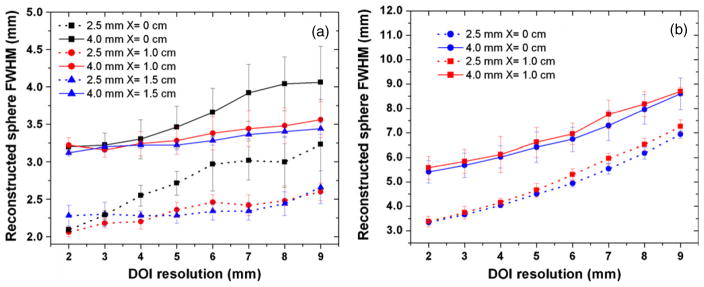
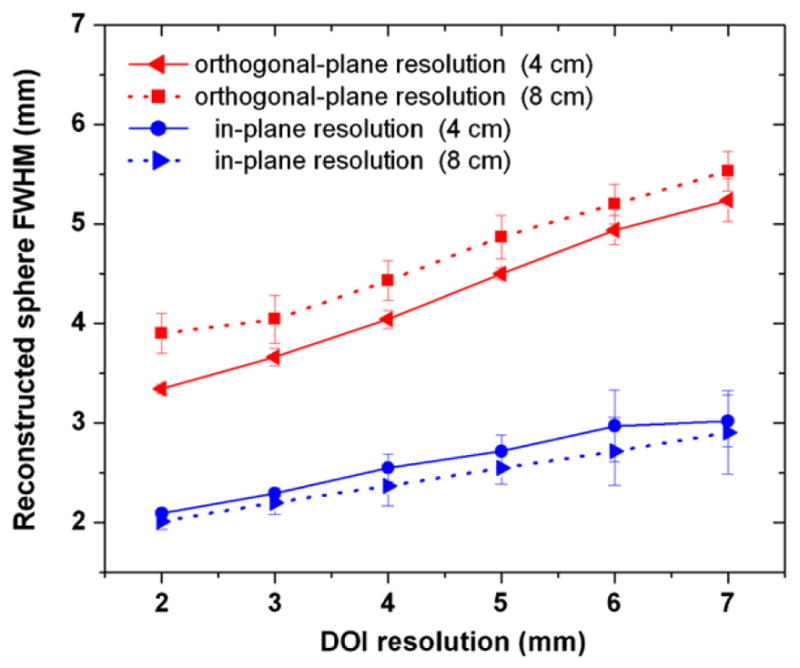
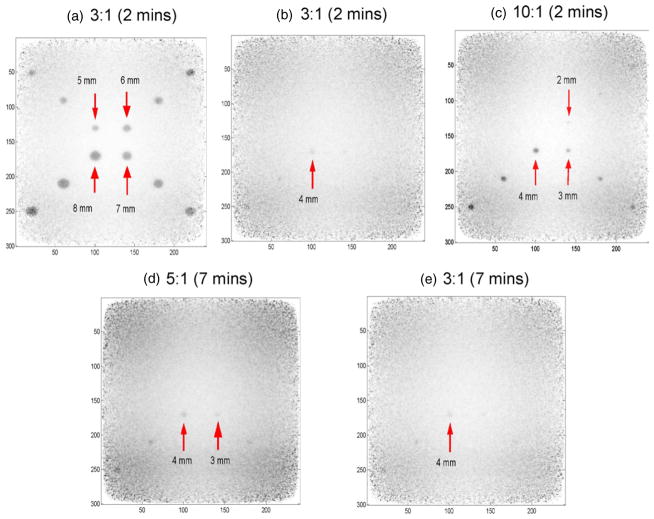
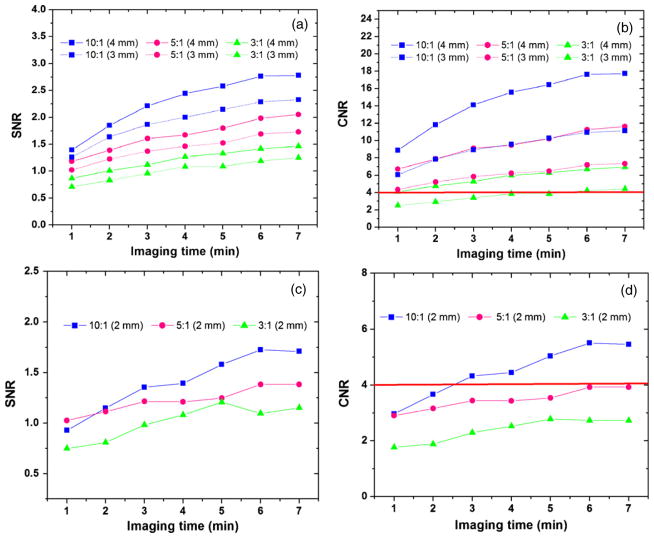
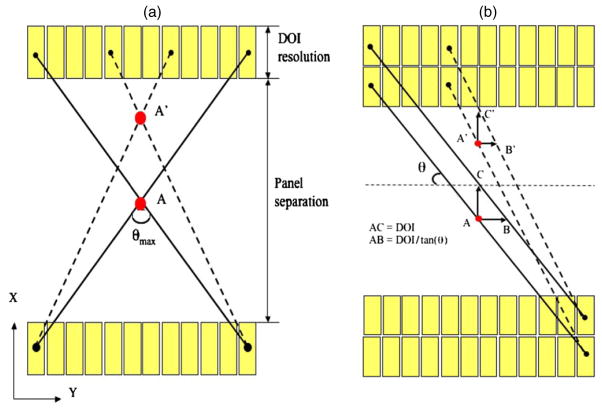
We studied the performance of a dual-panel positron emission tomography (PET) camera dedicated to breast cancer imaging using Monte Carlo simulation. The proposed system consists of two 4 cm thick 12 x 15 cm(2) area cadmium zinc telluride (CZT) panels with adjustable separation, which can be put in close proximity to the breast and/or axillary nodes. Unique characteristics distinguishing the proposed system from previous efforts in breast-dedicated PET instrumentation are the deployment of CZT detectors with superior spatial and energy resolution, using a cross-strip electrode readout scheme to enable 3D positioning of individual photon interaction coordinates in the CZT, which includes directly measured photon depth-of-interaction (DOI), and arranging the detector slabs edge-on with respect to incoming 511 keV photons for high photon sensitivity. The simulation results show that the proposed CZT dual-panel PET system is able to achieve superior performance in terms of photon sensitivity, noise equivalent count rate, spatial resolution and lesion visualization. The proposed system is expected to achieve approximately 32% photon sensitivity for a point source at the center and a 4 cm panel separation. For a simplified breast phantom adjacent to heart and torso compartments, the peak noise equivalent count (NEC) rate is predicted to be approximately 94.2 kcts s(-1) (breast volume: 720 cm(3) and activity concentration: 3.7 kBq cm(-3)) for a approximately 10% energy window around 511 keV and approximately 8 ns coincidence time window. The system achieves 1 mm intrinsic spatial resolution anywhere between the two panels with a 4 cm panel separation if the detectors have DOI resolution less than 2 mm. For a 3 mm DOI resolution, the system exhibits excellent sphere resolution uniformity (sigma(rms)/mean) < or = 10%) across a 4 cm width FOV. Simulation results indicate that the system exhibits superior hot sphere visualization and is expected to visualize 2 mm diameter spheres with a 5:1 activity concentration ratio within roughly 7 min imaging time. Furthermore, we observe that the degree of spatial resolution degradation along the direction orthogonal to the two panels that is typical of a limited angle tomography configuration is mitigated by having high-resolution DOI capabilities that enable more accurate positioning of oblique response lines.


Figures

Figure 1
Figure 1
(a) Illustration of the proposed dual-panel CZT-based PET system for breast cancer imaging. (b) Each panel has dimensions of 4 × 12 × 15 cm3, consisting of 180 modules in total. Each detector module has dimensions of 4 × 4 × 0.5 cm3 with 25 μm inter-module spacing, giving a packing ratio of over 99%. Incoming photons encounter a minimum 4 cm thick CZT material. Cross-strip electrodes with sets of parallel anode (1 mm pitch) and cathode (5 mm pitch) strips deposited on either side of the CZT slab are employed to reduce the number of electronic readout channels. In the arrangement shown, DOI resolution is defined by the cathode strip pitch. (c) The pictures of anode and cathode electrodes. (d) An energy spectrum of the proposed CZT detector for 511 keV photons.
Figure 2
Figure 2
The simulated model for system NEC and resolution studies. A hot spherical heart with a 10 cm diameter and a warm torso of dimensions of 30 × 20 × 30 cm3 are adjacent to breast phantom. The breast phantom fills in the space between two panels and is not shown. The center of the heart phantom and the center of the breast phantom have the same Z value but are separated by 13 cm along the Y direction. This implies that the hot heart extends to within 2 cm of the edge of the panels. The center of the torso phantom and the center of the breast phantom have the same Z value but are separated by 7.5 cm along the X direction. For the NEC studies, the panel separation was 4 cm and the activity concentration ratio assumed for breast–heart–torso was 1:10:1.
Figure 3
Figure 3
System photon sensitivity with a point source at the system center as a function of the distance (mm) from the center along the X, Y, Z directions for 4 cm (top curves) and 8 cm (bottom curves) panel separation. For these studies the energy window is 6% (496–526 keV) centered on 511 keV and the coincidence time window is 16 ns. For 8 cm panel separation, the FOV is larger so that it has more data points along the X direction. See figure 1 for definition of the axes.
Figure 4
Figure 4
(a), (b) System NEC as a function of different time window and energy window centered at 511 keV for a 4 cm panel separation (the breast activity concentration of 7.4 kBq cm−3). The peak NEC rate reaches a plateau at ~131 kcts s−1 around a coincidence time window of ~6–8 ns and an energy window of 10% at 511 keV. (c) Comparison of NEC performance among three system configurations.
Figure 5
Figure 5
(a) In-plane (parallel to panels) reconstructed image slices through warm spheres in cold background with varying DOI resolution for 1.0 mm (top) and 1.5 mm (bottom) diameter spheres. Pixel size: 0.5 mm. The simulated spheres were placed on a plane midway between the two panels which were separated by 4 cm. From the left to the right, the DOI resolution is varied from 1 mm to 5 mm in 1 mm increments. (b) 1D profile for the first row in each quadrant in YZ plane, which corresponds to the in-plane sphere resolution. (c) The 1D profile crossing the second and third sphere along the 1D profile in (b) and the peak-to-valley ratio (PVR) is calculated for two peaks, as a function of the five DOI resolution values. (d) Orthogonal-plane (perpendicular to panels, XY plane) images for the first row in each quadrant with a DOI resolution of 1 mm and 5 mm. (e) the 1D profile of the topmost sphere in (d) for 1.5 mm diameter spheres, which corresponds to the orthogonal-plane sphere resolution.
Figure 6
Figure 6
Reconstructed image slices through warm spheres in air with different DOI resolutions (0, 2, 5 and 10 mm). Pixel size: 0.5 mm. The simulated tumor diameters are 2.5 mm, 3.0 mm, 3.5 mm and 4.0 mm with twice that separation between centers placed on the YZ plane (X = 0) between the two panels separated by 4 cm. (a) In-plane (parallel to panels) (YZ plane) images (15 × 12 cm2). (b) One quadrant (6 × 4 cm2) of the orthogonal-plane (perpendicular to panels) (XY plane) images going through the 2.5 mm diameter spheres. (See figure 2 for definition of the axes.) The latter is zoomed for ease of visualization.
Figure 7
Figure 7
Results from analysis of spatial resolution studies. (a) In each quadrant of the in-plane (parallel to panels) slice through the reconstructed six spheres (see figure 6(a)), the 1D profile of the first row (row index = 1) was fitted with six Gaussian distributions on top of a linear background. (b) The reconstructed in-plane sphere FWHM as a function of the DOI resolution. (c) The reconstructed orthogonal-plane (perpendicular to panels) sphere FWHM as a function of the DOI resolution. The analysis was not performed for the 1.0 mm and 1.5 mm spheres (figure 5) since the reconstructed pixel size of 0.5 mm limited the number of samples available for fitting.
Figure 8
Figure 8
Resolution uniformity study for both central plane (X = 0) and off-center plane (X = 1.5 cm) is shown for (a) in-plane (parallel to panels) and (b) orthogonal-plane (perpendicular to panels) reconstructed image slices. DOI resolution is set to be 2 mm and the panel separation is 4 cm. Within inherent error, the system achieves very uniform in-plane and orthogonal-plane resolutions. However, a dependence of in-plane resolution on the off-center distance (X value) is observed. In the in-plane slices this dependence is most noticeable for the smaller sphere sizes. The definition of row index is shown in figure 6.
Figure 9
Figure 9
The reconstructed sphere resolution dependence on the off-center location of spheres (X value) for 2.5 mm diameter (bottom curves) and 4.0 mm diameter (top curves) spheres. The panel separation is 4 cm. (a) For the in-plane resolution, X = 0, 1.0 and 1.5 cm were studied. (b) For the orthogonal-plane resolution, only X = 0 and 1.0 cm were studied (b) (the tails of the 4.0 spheres sphere overlap the panel for X = 1.5 cm along the X direction).
Figure 10
Figure 10
In-plane (parallel to panels) and orthogonal-plane (perpendicular to panels) reconstructed sphere resolutions versus DOI resolution for the 4 cm and 8 cm panel separation. The spheres of 2.5 mm size were chosen for the comparison. The same phantom as that simulated in figure 6 was used. DOI resolutions from 2 mm to 7 mm were studied. The larger panel separation has no statistically significant impact on the in-plane reconstructed sphere resolution but slightly degrades the orthogonal-plane reconstructed sphere resolution.
Figure 11
Figure 11
In-plane reconstructed spheres of various sizes and activity concentration ratios in warm background for signal to noise and contrast to noise ratio studies (DOI resolution = 3 mm). The panel separation is 4 cm. The sphere sizes were 1–8 mm in diameter. The activity concentration ratios studied were 10:1, 5:1 and 3:1. The time inside the bracket indicates the imaging time. Spheres larger than 5 mm even with the low activity concentration ratio of 3 to 1 can be clearly resolved in 2 min. When the simulation is stopped at 7 min, the 2 mm sphere with a concentration ratio of 10:1 can be visualized. The visualization for spheres less than 1 mm diameter requires more statistics and is under investigation.
Figure 12
Figure 12
Reconstructed in-plane CNR and SNR for spheres of various sizes, activity concentration ratio and imaging time. The solid horizontal line in (b) and (d) marks the CNR being equal to 4, which is the requirement specified by the Rose criterion for good lesion detection. No interpretable results for 1 mm diameter spheres were obtained in this study.
Figure 13
Figure 13
(a) Illustration of the limited angle tomography effect. The dual-panel geometry only covers a certain limited range of projection angles (θmax less than 180°) and the incomplete angular sampling would cause resolution degradation or artifacts along the X direction (orthogonal to panels). (b) Illustration of the DOI blurring effect (also known as parallax error) and how it affects both the in-plane and orthogonal-plane resolutions. Only two layers of detectors are shown. For an adjacent parallel LOR pair, the effective blurring (i.e. parallax error) is AB (A′B′) along the Y direction (which affects the in-plane resolution) and AC (A′C′) along the X direction (which affects the orthogonal-plane resolution).

Similar articles

Cited by

References

    1. Alessio A, Kinahan P, Cheng P, Vesselle H, Karp J. PET/CT scanner instrumentation, challenges, and solutions. Radiol Clin N Am. 2004;42:1017–32. - PubMed
    1. Avril N, Menzel M, Dose J, Schelling M, Weber W, Jänicke F, Nathrath W, Schwaiger M. Glucose metabolism of breast cancer assessed by 18 F-FDG PET: histologic and immunohistochemical tissue analysis. J Nucl Med. 2001;42:9–16. - PubMed
    1. Baghaei H, Wong WH, Uribe J, Li H, Zhang N, Wang Y. Breast cancer studies with a variable field of view PET camera. IEEE Trans Nucl Sci. 2000;47:1080–4.
    1. Baines CJ, et al. Sensitivity and specificity of first screen mammography in the Canadian National Breast Screening Study; a preliminary report from five centers. Radiology. 1986;160:295–8. - PubMed
    1. Barrett HH, Eskin JD, Barber HB. Charge transport in arrays of semiconductor gamma-ray detectors. Phys Rev Lett. 1995;75:156–9. - PubMed

Publication types