. 2010 May;16(5):586-91, 1p following 591.
doi: 10.1038/nm.2130. Epub 2010 Apr 18.

A CD8+ T cell transcription signature predicts prognosis in autoimmune disease

Affiliations

A CD8+ T cell transcription signature predicts prognosis in autoimmune disease

Eoin F McKinney et al. Nat Med. 2010 May.

Abstract

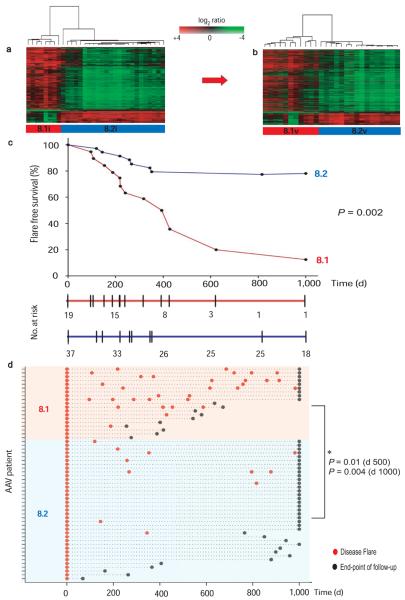
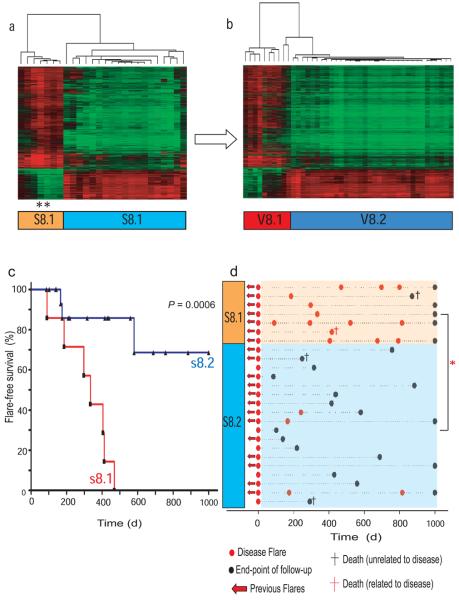
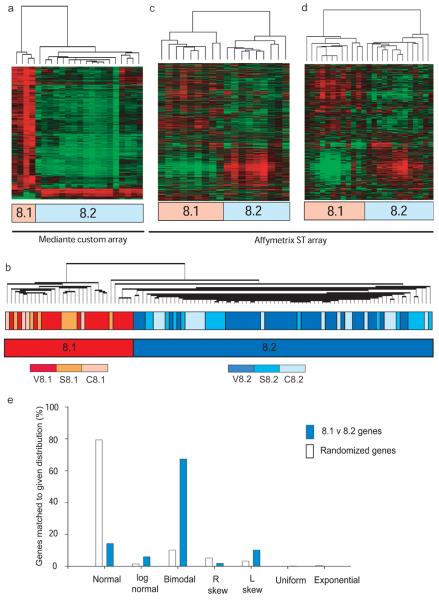
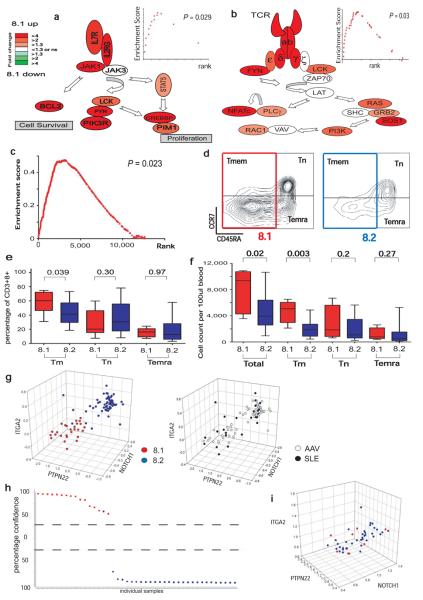
Autoimmune diseases are common and debilitating, but their severe manifestations could be reduced if biomarkers were available to allow individual tailoring of potentially toxic immunosuppressive therapy. Gene expression-based biomarkers facilitating such tailoring of chemotherapy in cancer, but not autoimmunity, have been identified and translated into clinical practice. We show that transcriptional profiling of purified CD8(+) T cells, which avoids the confounding influences of unseparated cells, identifies two distinct subject subgroups predicting long-term prognosis in two autoimmune diseases, antineutrophil cytoplasmic antibody (ANCA)-associated vasculitis (AAV), a chronic, severe disease characterized by inflammation of medium-sized and small blood vessels, and systemic lupus erythematosus (SLE), characterized by autoantibodies, immune complex deposition and diverse clinical manifestations ranging from glomerulonephritis to neurological dysfunction. We show that the subset of genes defining the poor prognostic group is enriched for genes involved in the interleukin-7 receptor (IL-7R) pathway and T cell receptor (TCR) signaling and those expressed by memory T cells. Furthermore, the poor prognostic group is associated with an expanded CD8(+) T cell memory population. These subgroups, which are also found in the normal population and can be identified by measuring expression of only three genes, raise the prospect of individualized therapy and suggest new potential therapeutic targets in autoimmunity.


Figures

Figure 1
Figure 1. T cell gene expression identifies a previously unrecognized subgroup of AAV patients at increased risk of relapsing disease
(a) Supervised hierarchical clustering using expression data from 925 genes > 2-fold significantly differentially expressed between the subgroups defined in Fig. S1 (false discovery rate (FDR) p<0.05) clusters the initial cohort of AAV patients (n = 32) into two distinct subgroups. (b) Hierarchical clustering of an independent validation cohort of AAV patients (n = 27) using expression data for the same gene list defined in (a) also identifies 2 distinct subgroups. Hierarchical clustering was performed using uncentered correlation and average-linkage. (c) Survival curve showing shorter time to first flare in v8.1 following induction therapy. Flare-free survival represented as proportion of all individuals reaching each timepoint with the numbers remaining at risk within each cohort detailed below. Significance was measured using the log-rank test. (d) Increased flare frequency in v8.1 when followed out to 1,000 days. Flare rate normalized to duration of follow-up performed at day 500 (mean flare rate 0.91/year v8.1 vs 0.17/year v8.2, p=0.01) and at day 1,000 (mean flare rate 0.81/year v8.1 vs 0.15/year v8.2, p=0.004).
Figure 2
Figure 2. The CD8 T cell signature that predicts prognosis in AAV defines analogous subgroups in SLE
Consensus subgroups in a cohort of 26 SLE patients were defined by unsupervised hierarchical clustering. (a) Supervised hierarchical clustering of the SLE cohort using 1,913 genes that best define the subgroups (>2-fold statistically significant differential expression, p<0.05, FDR<0.05). One patient (black asterisk) underwent repeat analysis at the time of a second disease flare 14 months after enrolment and remained in subgroup s8.1 despite alterations in therapy. (b) Hierarchical clustering of AAV samples using expression data for the same genes as in panel (a) reproduces the same subgroups as found with de novo unsupervized clustering of the AAV dataset. Genelists defining the 2 subgroups in vasculitis (n = 1,228) and SLE (1,913) cohorts were highly overlapping (overlap = 639 genes, hypergeometric p-value <1 × 10−300). (c) Kaplan-Meier plot showing shorter time to first flare in s8.1. Significance was measured using the log-rank test. (d) Increased flare frequency in subgroup s8.2 when followed out to 1,000 days. Red asterisk = mean flare-rate normalized per unit time follow-up with Mann Whitney U test of significance performed at day 500 (flare-rate 0.86/year v 0.08/year, p = 0.0006) and at day 1,000 (flare-rate 0.81/year vs 0.09/year, p = 0.001).
Figure 3
Figure 3. Similar subgroups can be identified in a healthy population, and the defining signature is composed of genes whose expression predominantly conforms to a bimodal distribution
Consensus subgroups in a cohort of 22 healthy Caucasian controls, age and sex-matched to the AAV cohort, were defined by unsupervised hierarchical clustering as for the disease cohorts. (a) The 944 genes best defining these subgroups (>2-fold statistically significant differential expression, FDR p<0.05) were subject to hierarchical clustering. (b) Unsupervised hierarchical clustering of a pooled CD8 T cell expression dataset including all samples (AAV, SLE and control) reproduces subgroups 8.1 and 8.2, but shows no clustering by disease status. (c, d) CD8 T cell RNA from a cohort of 18 healthy Caucasian (c) and 25 Singaporean (d) controls was hybridised to the Affymetrix Gene 1.0 ST Array. Each cohort was clustered using data derived from 780 genes which represent the subset of the genes used in panel (a) that could be mapped onto Affymetrix feature names using common Entrez IDs. Unsupervised de novo clustering produced the same subgroups (data not shown). (e) Matched expression density distributions for genes differentially-expressed (FDR<0.05, fold-change 1.5) between patients in two randomly assigned subgroups of the AAV dataset (n=392, open bars) or subgroups 8.1 and 8.2 (n=1860, blue bars) confirming significant deviation of expression pattern from normal to bimodality (chi-square p<0.001 for bimodal versus other).
Figure 4
Figure 4. Poor prognosis in AAV correlates with over expression of mRNAs encoding proteins associated with T cell survival and memory
(a, b) Magnitude and direction of differential gene expression between subgroups v8.1 and v8.2 for genes of (a) IL7R pathway (b) TCR signalling pathway. FDR p<0.05 and fold-change as illustrated by colour heatmap. Significance of enrichment was tested for the IL7R pathway (GSEA p=0.029, inset), Jak/Stat signalling pathway (Ingenuity, p<0.01, FDR<0.05, data not shown) and TCR signalling pathway (GSEA p=0.03, Ingenuity hypergeometric FDR p<0.05). (c) GSEA identified significant enrichment of a CD8 TEM signature in v8.1, p=0.023. (d) Memory T cell subsets of representative individuals from v8.1 (left panel) and v8.2 (right panel). Cells gated on CD3+ CD8+ showing naïve (TN, CD45RA+ CCR7+), memory (TMEM, CD45RA) and effector memory RA (TEMRA, CCR7 CD45RA+) populations as indicated. (e, f) Boxplots showing relative proportions (e) and absolute numbers (f) of total, memory, naïve and effector memory-RA CD8 T cells in the two subgroups. (g) 3D scatterplots showing the classification of combined SLE and AAV samples using CD8 expression data from 3 genes (ITGA2, NOTCH1, PTPN22) separating patients by prognostic subgroups in both diseases (left panel) with no differentiation between diseases (right panel). mRNA expression on x, y and z axes as log2 ratio. (h) A predictive model was derived using a support vector machines algorithm on a randomized, stratified 50% subset of all samples (training set) and its performance assessed on the remaining 50% (test set), shown in (h), PPV=94%, NPV=100%. y-axis = confidence of prediction (%). (i) 3D scatterplot of the AAV cohort by the same 3-gene classifer using PBMC-derived gene expression data.

Comment in

References

    1. Golub TR, et al. Molecular classification of cancer: class discovery and class prediction by gene expression monitoring. Science. 1999;286:531–7. - PubMed
    1. van't Veer LJ, Bernards R. Enabling personalized cancer medicine through analysis of gene-expression patterns. Nature. 2008;452:564–70. - PubMed
    1. Bryant PA, Smyth GK, Robins-Browne R, Curtis N. Detection of gene expression in an individual cell type within a cell mixture using microarray analysis. PLoS ONE. 2009;4:e4427. - PMC - PubMed
    1. Lyons PA, M. E, Rayner TF, Hatton A, Woffendin HB, Koukoulaki M, Freeman TC, Jayne DR, Chaudhry AN, Smith KGC. Novel expression signatures identified by transcriptional analysis of separated leukocyte subsets in SLE and vasculitis. Ann Rheum Dis. 2009 Epub ahead of print. - PMC - PubMed
    1. Lane SE, Watts RA, Shepstone L, Scott DG. Primary systemic vasculitis: clinical features and mortality. QJM. 2005;98:97–111. - PubMed

Publication types

MeSH terms

Substances