. 2010 May;42(5):454-8.
doi: 10.1038/ng.556. Epub 2010 Apr 18.

Subtle variations in Pten dose determine cancer susceptibility

Affiliations

Subtle variations in Pten dose determine cancer susceptibility

Andrea Alimonti et al. Nat Genet. 2010 May.

Abstract

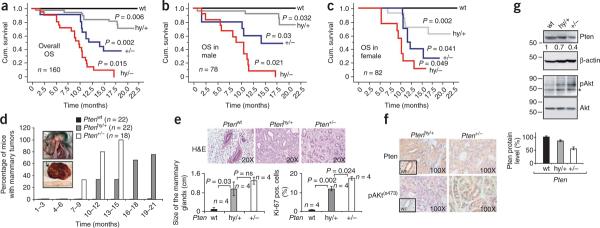
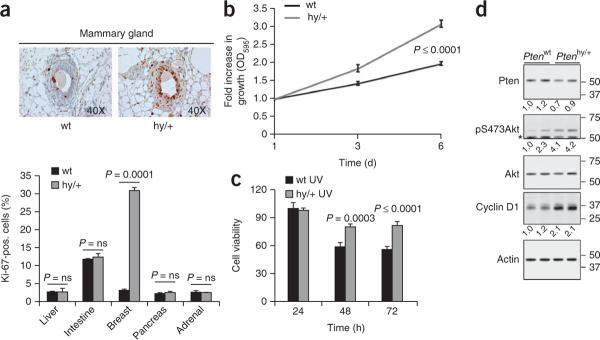
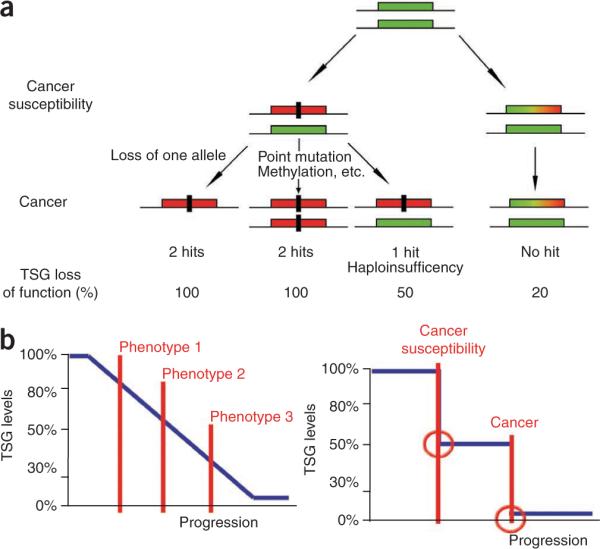
Cancer susceptibility has been attributed to at least one heterozygous genetic alteration in a tumor suppressor gene (TSG). It has been hypothesized that subtle variations in TSG expression can promote cancer development. However, this hypothesis has not yet been definitively supported in vivo. Pten is a TSG frequently lost in human cancer and mutated in inherited cancer-predisposition syndromes. Here we analyze Pten hypermorphic mice (Pten(hy/+)), expressing 80% normal levels of Pten. Pten(hy/+) mice develop a spectrum of tumors, with breast tumors occurring at the highest penetrance. All breast tumors analyzed here retained two intact copies of Pten and maintained Pten levels above heterozygosity. Notably, subtle downregulation of Pten altered the steady-state biology of the mammary tissues and the expression profiles of genes involved in cancer cell proliferation. We present an alterative working model for cancer development in which subtle reductions in the dose of TSGs predispose to tumorigenesis in a tissue-specific manner.


Figures

Figure 1
Figure 1
A subtle reduction in the dose of Pten dictates overall survival in Ptenhy/+ mice and initiates mammary tumorigenesis. (ac) Kaplan-Meier plots for overall survival in the general population (a) and in the male (b) and female (c) populations. hy/+, mice having a Pten hypomorphic and a wild-type (wt) allele; hy/−, mice having a Pten hypomorphic and null allele; +/−, mice having a Pten wt and null allele. OS, overall survival; n, number of mice analyzed; P, statistical significance. (d) Percentage of mice with mammary tumors according to age in the female population; n, number of animals analyzed; P, statistical significance. Inset is a representative image of a mammary tumor in Ptenhy/+ mice. (e) Top, H&E staining (×20) of a Ptenwt normal mammary gland and Ptenhy/+ and Pten+/− mammary tumors. Bottom, average size and Ki-67 proliferative index of the Ptenwt mammary glands and Ptenhy/+ and Pten+/− mammary tumors. (f) Immunohistochemical analysis for Pten and pAkt in Ptenhy/+ and Pten+/− mammary tumors (four tumors for each genotype were analyzed). The insets in Ptenhy/+ show a representative image (×40) for Pten and pAkt staining in a control mammary gland. (g) Protein blot analysis for Pten and pAkt protein levels (above) in Ptenwt, Ptenhy/+ and Pten+/− mammary tumors showing the presence of Pten protein and the corresponding pAkt level. Bottom, quantification of Pten protein level in mammary tumors from Ptenwt, Ptenhy/+ and Pten+/− mice. Error bars, s.d. from three independent experiments. Asterisk indicates a nonspecific band observed when blotting protein extracted from mouse tissue. Numbers to the left of the blots represent molecular weight markers in kDa; those below the Pten blot indicate densitometrically quantified protein levels that have been normalized to β-actin. Presentation of cropped images is in accordance with Nature Publishing Group policy.
Figure 2
Figure 2
A subtle variation of Pten gene expression promotes hyper proliferation in a tissue-specific manner. (a) Representative images of mammary tissue (above) and quantification (below) of Ki-67 staining in tissues from 2-month-old Ptenwt and Ptenhy/+ littermate mice. P, statistical significance; error bars, s.d. (b) Growth curve analysis of Ptenwt and Ptenhy/+ mouse mammary epithelial cells. Error bars, s.d. (c) Analysis of the cell viability (at the indicated time points) of Ptenwt and Ptenhy/+ mouse mammary epithelial cells after treatment with ultraviolet irradiation (at 60 J/m2). (d) Protein blot analysis for Pten, pAkt and Cyclin D1 protein levels in Ptenwt and Ptenhy/+ MMECs. Asterisk indicates residual Pten signal that is present because the membrane was not stripped prior to blotting for pAkt. Numbers to the right of the blots represent molecular weight markers in kDa; those numbers below the blots indicate densitometrically quantified protein levels for Pten (normalized to β-actin) and pAkt (normalized to total Akt). Presentation of cropped images is in accordance with Nature Publishing Group policy.
Figure 3
Figure 3
Graphic representation of the correlation between Pten dosage (showing percent of normal levels), Akt signaling intensity and the corresponding observed incidence for the indicated phenotypes.
Figure 4
Figure 4
Gene expression profiles of Ptenhy/+ MEFs, MMECs and human breast cancer samples with reduced PTEN levels. (a) A subtle decrease in Pten levels significantly modulates three gene expression signatures for cell cycle (GNF2_CSK1B, GNF2_CDC2 and GNF2_CDC20) in Ptenhy/+ MEFs. Genes are ranked by signal to noise ratio according to their differential expression between Ptenhy/+ MEFs and controls. Genes in the lineage-specific gene sets are marked with vertical bars, and the enrichment score is shown in green. (b) Quantitative RT-PCR analysis in Ptenwt and Ptenhy/+ MMECs for the indicated genes. P, statistical significance. Error bars, s.e.m. of four independent mice (two to four samples per MMEC culture and mouse). (c) Stratification of the gene datasets upregulated in Ptenhy/+ MEFs according to GO-BP.
Figure 5
Figure 5
Implications for tumorigenesis upon subtle reduction of TSG levels. (a) The `no hits' model of cancer susceptibility. The rectangular green box represents a functional allele of a given TSG. The rectangular red box represents a nonfunctional allele inactivated by, for example, mutation or deletion. The rectangular green, yellow and red box represents an allele of a TSG whose expression is reduced below the normal levels. The black rectangle represents a genetic hit. Note that the model represented does not exclude the presence of additional hits on other loci. (b) A continuum model (left) for cancer initiation and promotion vis-à-vis a saltatory model (right). Note that in the continuum model, even subtle reductions in the dose of a TSG can initiate tumorigenesis in a tissue-specific manner. Phenotypes 1, 2 and 3 indicate that with the reduction of the TSG dose, the tumor phenotype can change in a tissue-specific manner, increasing incidence and aggressiveness of the disease. In the saltatory model, cancer arises from a stepwise genetic mutation–driven allelic loss.

Similar articles

Cited by

References

    1. Friend SH. Alfred Knudson: the importance of a visionary who enables scientists. Genes Chromosom. Cancer. 2003;38:326–328. - PubMed
    1. Trotman LC, et al. Pten dose dictates cancer progression in the prostate. PLoS Biol. 2003;1:E59. - PMC - PubMed
    1. Yan H, et al. Small changes in expression affect predisposition to tumorigenesis. Nat. Genet. 2002;30:25–26. - PubMed
    1. Salmena L, Carracedo A, Pandolfi PP. Tenets of PTEN tumor suppression. Cell. 2008;133:403–414. - PubMed
    1. Knudson AG. Two genetic hits (more or less) to cancer. Nat. Rev. Cancer. 2001;1:157–162. - PubMed

Publication types