. 2010 Jul;114(1):182-90.
doi: 10.1111/j.1471-4159.2010.06743.x. Epub 2010 Apr 9.

Signaling pathways controlling the phosphorylation state of WAVE1, a regulator of actin polymerization

Affiliations

Signaling pathways controlling the phosphorylation state of WAVE1, a regulator of actin polymerization

Ilaria Ceglia et al. J Neurochem. 2010 Jul.

Abstract

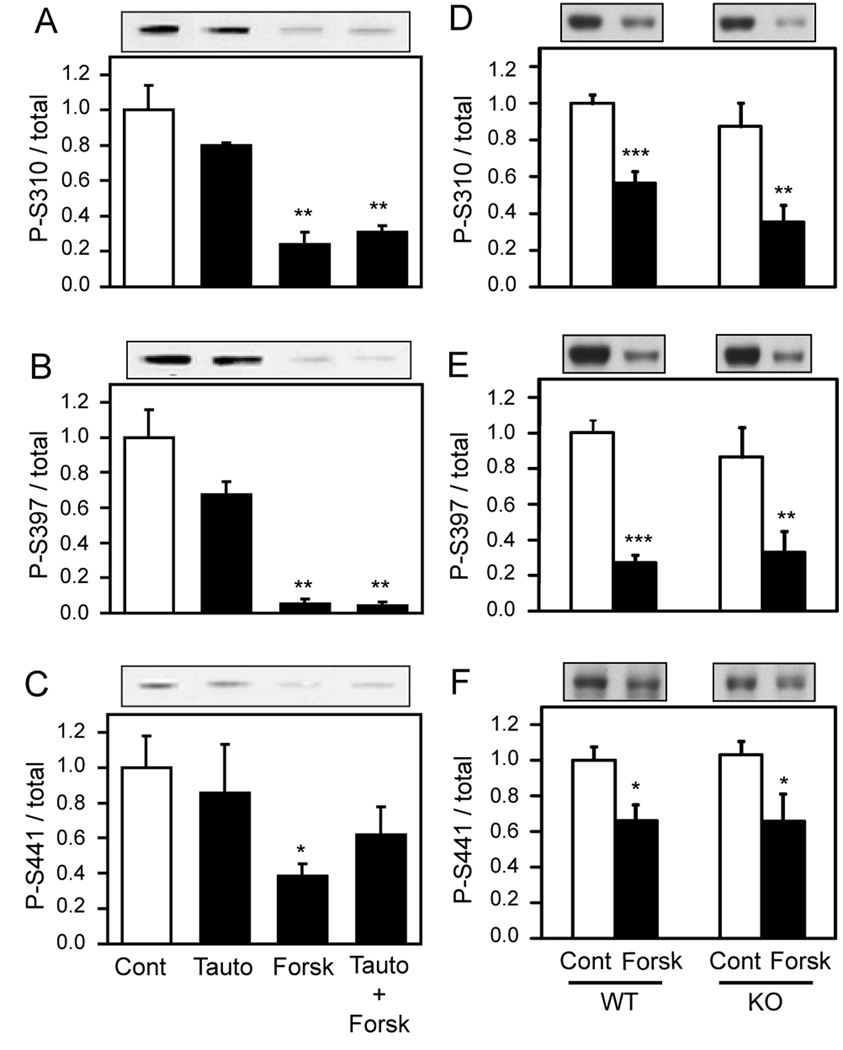
The Wiskott-Aldrich syndrome protein (WASP)-family verprolin homologous protein 1 (WAVE1) is a key regulator of Arp (actin-related protein) 2/3 complex-mediated actin polymerization. We have established previously that the state of phosphorylation of WAVE1 at three distinct residues controls its ability to regulate actin polymerization and spine morphology. Cyclin-dependent kinase 5 phosphorylates WAVE1 at Ser310, Ser397 and Ser441 to a high basal stoichiometry, resulting in inhibition of WAVE1 activity. Our previous and current studies show that WAVE1 can be dephosphorylated at all three sites and thereby activated upon stimulation of the D1 subclass of dopamine receptors and of the NMDA subclass of glutamate receptors, acting through cAMP and Ca(2+) signaling pathways, respectively. Specifically, we have identified protein phosphatase-2A and protein phosphatase-2B as the effectors for these second messengers. These phosphatases act on different sites to mediate receptor-induced signaling pathways, which would lead to activation of WAVE1.


Figures

Figure 1
Figure 1. Time course of forskolin-induced WAVE1 dephosphorylation
Mouse striatal slices were incubated without (DMSO vehicle) or with forskolin (Forsk, 1 µM) for the indicated times. The levels of total p35 (A), Cdk5 (B), and WAVE1 (C) and the phosphorylation of WAVE1 at Ser310 (D), Ser397 (E), and Ser441 (F) were measured by immunoblotting (upper) and the results were quantified by densitometry (lower). The data were normalized to the values obtained from control (DMSO) treated slices at each time point. Data represent means ± SEM for four experiments. *, P< 0.05, **, P< 0.01; ***, P< 0.001 versus the value at 0 min; one-way ANOVA with Tukey’s multiple comparison test.
Figure 2
Figure 2. The role of PP-2A in forskolin-induced dephosphorylation of WAVE1
A, Striatal slices were incubated in the absence (DMSO vehicle) or presence of the indicated concentrations of okadaic acid (OKA) for 1 hr. The levels of phospho-WAVE1 (upper) and total WAVE1 (not shown) were measured by immunoblotting. Treatment of the slices with different concentration of OKA did not significantly alter the level of total WAVE1. The results were quantified by densitometry, and the phospho-site data normalized to total WAVE1 (lower). Data were also normalized to the values obtained with DMSO (1 hr) treated slices. Data represent means ± SEM for four experiments. *, P< 0.05, ***, P< 0.001 versus the value at 0 (DMSO only); one-way ANOVA with Tukey’s multiple comparison test. B–D, Striatal slices were pretreated with DMSO or okadaic acid (OKA, 1 µM) for 90 min, during the last 30 min of which forskolin (Forsk, 1 µM) was added, as indicated. The levels of the phosphorylation of WAVE1 (upper) at Ser310 (B), Ser397 (C) and Ser441 (D), and total WAVE1 (not shown) were measured by immunoblotting. The representative immunoblot images correspond to the four groups of the treatment as indicated. The indicated treatments did not significantly alter the level of total WAVE1. Results were quantified by densitometry and the phospho-site data normalized to total WAVE1 (lower). Data, normalized to control (Cont) values, represent means ± SEM for at least six experiments. **, P< 0.01; ***, P< 0.001 versus control; , P< 0.05 versus forskolin alone; , P< 0.05 versus OKA alone; one-way ANOVA with Tukey’s multiple comparison test.
Figure 3
Figure 3. The role of PP-1 in forskolin-induced dephosphorylation of WAVE1
A–C, Striatal slices were pretreated with DMSO or tautomycetin (Tauto, 1 µM) for 90 min, during the last 30 min of which forskolin (Forsk, 1 µM) was added, as indicated. The levels of phospho-Ser310 (A), phospho-Ser397 (B) or phospho-Ser441 (C) of WAVE1 (upper) and total WAVE1 (not shown) were measured by immunoblotting. The representative immunoblot images correspond to the four groups of the treatment as indicated. The indicated treatments did not significantly alter the level of total WAVE1. The data were analyzed using the Odyssey infrared imaging system and the phospho-site data was normalized to total WAVE1 (lower). Data, normalized to control (Cont) values, represent means ± SEM for four experiments; one-way ANOVA with Tukey’s multiple comparison test. D–F, Striatal slices prepared from wild-type (WT) or DARPP-32 knockout mice (KO) were incubated in the presence of DMSO (Cont) or forskolin (Forsk, 1 µM) for 30 min. The representative immunoblot images for WT or DARPP-32 KO slices are shown in upper panels and quantification is shown in the lower panels. Data, normalized to control values for WT, represent means ± SEM for six experiments. *, P< 0.05; **, P< 0.01; ***, P< 0.001 versus control, Student’s t test.
Figure 4
Figure 4. The role of PP-2B in forskolin-induced dephosphorylation of WAVE1
A–C, Striatal slices were pretreated with DMSO or cyclosporin A (CyA, 10 µM) for 90 min, during the last 30 min of which forskolin (Forsk, 1 µM) was added, as indicated.. The levels of phospho-WAVE1 (upper) and total WAVE1 (not shown) were measured by immunoblotting. The representative immunoblot images correspond to the four groups of the treatment as indicated. The indicated treatments did not significantly alter the level of total WAVE1. The data were quantified by densitometry and the phospho-site data were normalized to total WAVE1. Data, normalized to control values, represent means ± SEM for eight experiments. *, P< 0.05; ***, P< 0.001 versus control, one-way ANOVA with Tukey’s multiple comparison test. D–F, Striatal slices prepared from WT or RCS KO mice were incubated in the presence of DMSO (Cont) or forskolin (Forsk, 1 µM) for 30 min. The representative immunoblot images for WT or RCS KO slices are shown in upper panels and quantification is shown in the lower panels. Data, normalized to control values, represent means ± SEM for nine experiments. *, P< 0.05; ***, P< 0.001 versus control, Student’s t test.
Figure 5
Figure 5. Time course of NMDA-induced WAVE1 dephosphorylation
Striatal slices were incubated with NMDA (100 µM) for the indicated times. Levels of total p35 (A), Cdk5 (B), and WAVE1 (C) and the phosphorylation of WAVE1 at Ser310 (D), Ser397 (E), and Ser441 (F) were measured by immunoblotting (upper) and results quantified by the Odyssey infrared imaging system (lower). Quantitative results were normalized to the values obtained from slices at 0 min. Data represent means ± SEM for experiments. **, P< 0.01; ***, P< 0.001 compared with 0 min, one-way ANOVA with Tukey’s multiple comparison test.
Figure 6
Figure 6. The role of PP-2A and PP-2B in NMDA-induced dephosphorylation of WAVE1
Striatal slices were preincubated either with (A–C) okadaic acid (OKA, 1 µM) or (D–F) cyclosporin A (CyA, 10 µM) for 40 min and then incubated with NMDA (100 µM) for an additional 10 min. Control slices were pretreated with DMSO for 40 min and then incubated in the presence of vehicle (water) for 10 min (Cont).The levels of phospho-WAVE1 (upper) and total WAVE1 (not shown) were measured by immunoblotting. The representative immunoblot images correspond to the four groups of the treatment as indicated. The indicated treatments did not significantly alter the level of total WAVE1. The data were analyzed using the Odyssey infrared imaging system, and phospho-site data were normalized to total WAVE1 (lower). Data, normalized to control values, represent means ± SEM for five to six experiments. **, P< 0.01, ***, P< 0.001 versus control; one-way ANOVA with Tukey’s multiple comparison test.
Figure 7
Figure 7. The role of PP-2A and PP-2B in neurotransmitter-induced dephosphorylation of WAVE1
Cdk5 phosphorylates WAVE1 at Ser310, Ser397 and Ser441 with high stoichiometry under basal conditions (blue arrows). Stimulation of dopamine D1 receptors induces cAMP/PKA signaling. PP-2A mediates dephosphorylation at Ser310 and Ser397, while PP-2B mediates dephosphorylation at Ser441. Stimulation of NMDA receptors increases intracellular calcium levels. Calcium-dependent PP-2A mediates dephosphorylation at Ser310 and Ser441, while PP-2B mediates dephosphorylation at Ser397.

References

    1. Ahn JH, McAvoy T, Rakhilin SV, Nishi A, Greengard P, Nairn AC. Protein kinase A activates protein phosphatase 2A by phosphorylation of the B56delta subunit. Proc. Natl Acad. Sci. USA. 2007a;104:2979–2984. - PMC - PubMed
    1. Ahn JH, Sung JY, McAvoy T, Nishi A, Janssens V, Goris J, Greengard P, Nairn AC. The B"/PR72 subunit mediates Ca2+-dependent dephosphorylation of DARPP-32 by protein phosphatase 2A. Proc. Natl Acad. Sci. USA. 2007b;104:9876–9881. - PMC - PubMed
    1. Ardern H, Sandilands E, Machesky LM, Timpson P, Frame MC, Brunton VG. Src-dependent phosphorylation of Scar1 promotes its association with the Arp2/3 complex. Cell Motil. Cytoskeleton. 2006;63:6–13. - PubMed
    1. Bibb JA, Snyder GL, Nishi A, Yan Z, Meijer L, Fienberg AA, Tsai LH, Kwon YT, Girault JA, Czernik AJ, Huganir RL, Hemmings HC, Jr, Nairn AC, Greengard P. Phosphorylation of DARPP-32 by Cdk5 modulates dopamine signalling in neurons. Nature. 1999;402:669–671. - PubMed
    1. Cheng A, Arumugam TV, Liu D, Khatri RG, Mustafa K, Kwak S, Ling HP, Gonzales C, Xin O, Jo DG, Guo Z, Mark RJ, Mattson MP. Pancortin-2 interacts with WAVE1 and Bcl-xL in a mitochondria-associated protein complex that mediates ischemic neuronal death. J. Neurosci. 2007;27:1519–1528. - PMC - PubMed

Publication types