

doi: 10.1186/1757-5036-3-9.
Live cell flattening - traditional and novel approaches
Affiliations
- PMID: 20403171
- PMCID: PMC2873278
- DOI: 10.1186/1757-5036-3-9
Item in Clipboard
Live cell flattening - traditional and novel approaches
PMC Biophys.
.
Abstract
Eukaryotic cell flattening is valuable for improving microscopic observations, ranging from bright field (BF) to total internal reflection fluorescence (TIRF) microscopy. Fundamental processes, such as mitosis and in vivo actin polymerization, have been investigated using these techniques. Here, we review the well known agar overlayer protocol and the oil overlay method. In addition, we present more elaborate microfluidics-based techniques that provide us with a greater level of control. We demonstrate these techniques on the social amoebae Dictyostelium discoideum, comparing the advantages and disadvantages of each method.PACS Codes: 87.64.-t, 47.61.-k, 87.80.Ek.
Figures
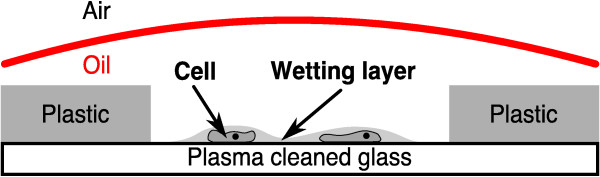
Oil overlay technique. A drawing of the oil overlayer technique on a modified glass bottom Petri dish. The arrows mark the D. discoideum cells (not to scale) and the surrounding wetting layer. Most of the wetting fluid is removed by a cotton thread (not shown) placed on the glass surface, which leads to flattening of the cells.
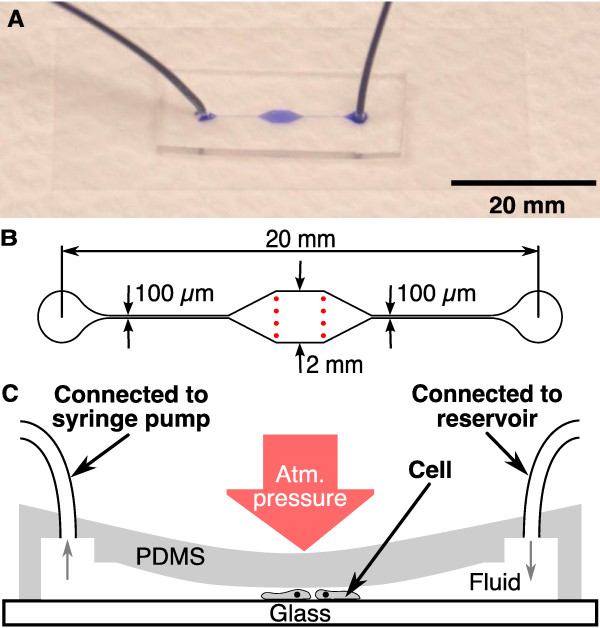
Single layer microfluidic device. (A) Assembled single layer device with connected tubing, filled with ink. (B) Geometry of the chrome mask used to create the single layer device. The height of this channel was 14 μm. Two rows of pillars (red spots) support the ceiling. In (C), the principle of operation is shown. The inlet of the collapsing device is connected to a reservoir, filled with PB. A syringe pump removes the fluid at a constant rate (indicated by the gray arrows) and thus decreases the pressure within the microfluidic channel. This leads to a collapse of the ceiling and therefore to flattening of D. discoideum cells located in the channel.
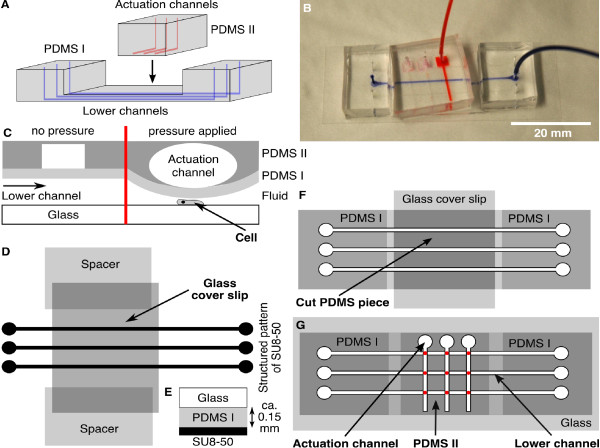
Microfluidic closed-end actuator. (A) The closed-end actuator consists of a lower layer (PDMS I) with channels containing the cells (blue) and an upper layer (PDMS II) with the actuation channels (red). (B) Photograph of the assembled closed-end actuator filled with ink (actuation channel in red and lower channel in blue). (C) The principle of operation for the closed-end actuator. (D) To create the lower layer, PDMS was poured onto the wafer. Then a cover slip was placed across the pattern. This cover slip rests on two other cover slips, which act as spacers that define the height of the PDMS layer (E). This layer will separate the lower and the upper channels. (F) After curing and cutting the PDMS, the middle section was cut out and stored. The first cover slip was replaced by a second cover slip and the cut PDMS piece is placed in its former position to provide stability during plasma cleaning. (G) Illustration of the assembled double layer device. The lower layer (PDMS I) contains the microfluidic channel filled with the cells. The upper layer (PDMS II) contains the closed-end channel which applies pressure to the channel below. The red spots in (G) mark the overlapping areas, in which flattening of the cells occur.
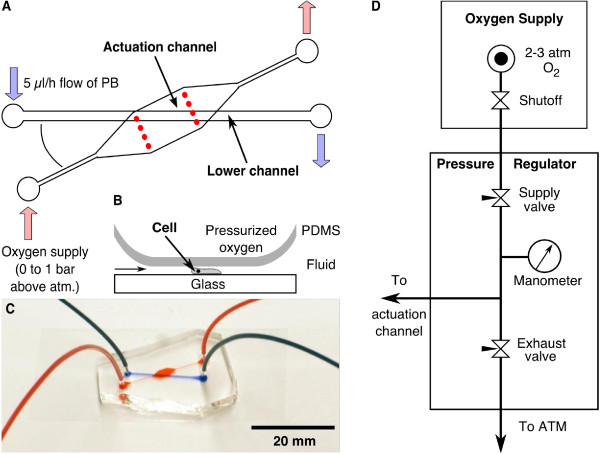
Microfluidic through-flow actuator. (A) Similar to the closed-end actuator, the cells are contained in the bottom channel. In this case, however, the actuation channel was open ended allowing oxygen to flow through. The oxygen was supplied to the cells via the permeable PDMS membrane which separates the two layers (B). By adjusting the pressure of the oxygen supply at the inlet, this PDMS membrane was deformed and flattened the cells. The angle between both channels was limited by the size of the cover slip. (C) Assembled double layer microfluidic channel with connected tubing. The actuation channel is filled with red and the lower channel with blue dye. (D) Schematic of the pressure regulation of the oxygen flowing through the actuation channel. The manometer measures the pressure applied to the actuation channel.
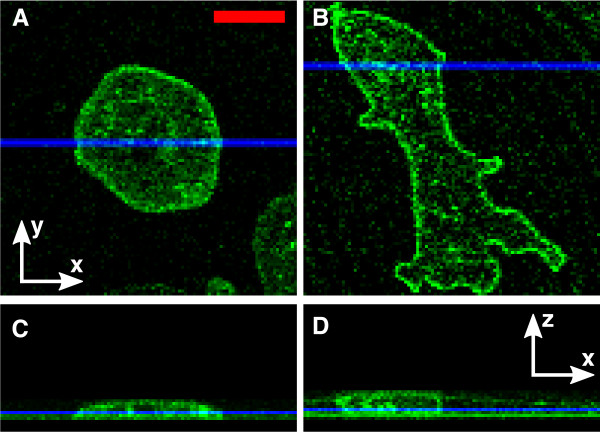
Flattening of D. discoideum under agar and oil overlayer. cAR1-GFP labeled cells below an agar (A, C) and oil (B, D) overlayer. (A) and (B) show confocal x-y scans. (C) and (D) show the corresponding z-stacks of those cells. The blue lines in (A, B) show the y-values of sections (C, D), and the blue lines in (C, D) show the z-value of images (A, B). Scale bar: 10 μm.
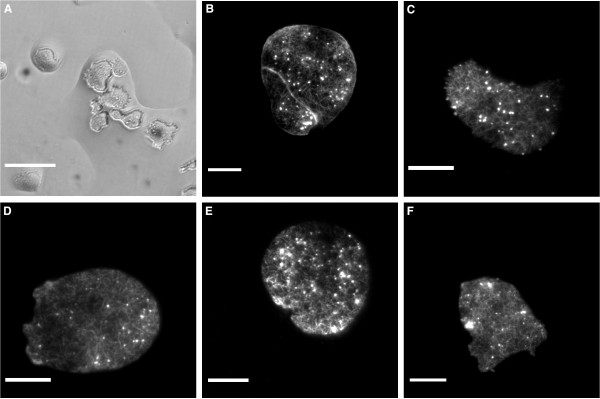
Sample Images using D. discoideum LimE-GFP. (A) BF image of cells under an oil overlayer. The breakup of the wetting layer can be seen, with flatten cells confined inside small aqueous islands. (B-F) TIRF microscopy images of cells flattened by the agar overlay (B), the oil overlay (C), the single layer microfluidic device (D), the closed-end actuator (E) and the through-flow actuator (F). Scale bar in A is 50 μm and the scale bars in B to E display 10 μm.
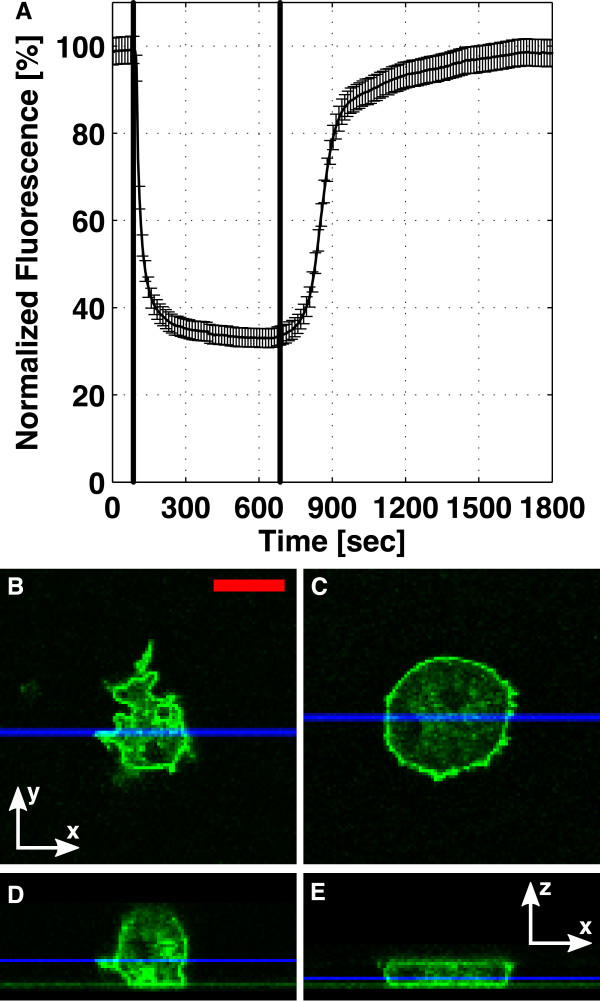
Characterization of the single layer microfluidic device. (A) The channel was filled with 100 μM fluorescein, and the intensity in the middle of the device was recorded. Between t = 85 s (line 1) and t = 685 s (line 2), the syringe pump withdrew 250 μl/h of the fluorescein through the device, leading to a drop in the channel height. This flow rate was used to flatten cAR1-GFP cells. Confocal x-y scans are shown for a cAR1-GFP cell (B) before and (C) during flattening. (D, E) show the corresponding x-z sections. The blue lines in (B, C) show the y-values for the sections (D, E), and the blue lines in (D, E) show the z-value of images (B, C). Scale bar: 10 μm.
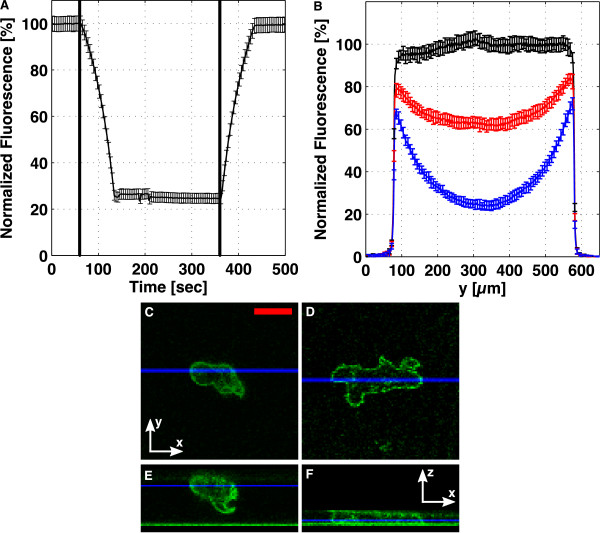
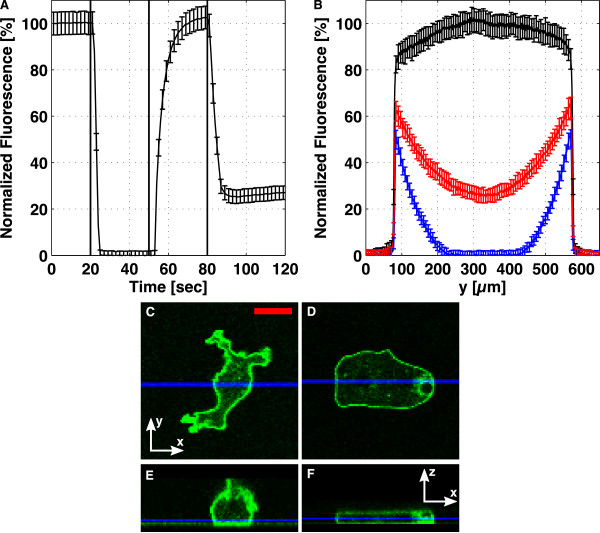
Characterization of the closed-end actuator. The lower channel was filled with 100 μM fluorescein, and in (A), the fluorescence in the middle of the channel is displayed, as the pressure in the actuation channel is increased, t = 60 s to t = 130 s, and then, as the pressure is released, t = 360 s to 430 s. (B) shows the profile across the channel for different degrees of flattening, with the black, red and blue curves corresponding to t = 20 s, 110 s, and 300 s in (A). Confocal x-y scans are shown for a cAR1-GFP cell (C) before and (D) during flattening. (E, F) show the corresponding x-z sections. The blue lines in (C, D) show the y-values for the sections (E, F), and the blue lines in (E, F) show the z-value of images (C, D). Scale bar: 10 μm.
Characterization of the through-flow actuator. The lower channel was filled with 100 μM fluorescein, and in (A), the fluorescence in the middle of the channel is shown. At t = 20 s (line 1), the pressure in the actuation channel was increased by 0.4 bar, at t = 40 s (line 2), the pressure was released, and at t = 80 s (line 3), the pressure was increased to 0.2 bar above atmosphere. (B) shows the profile across the channel for different degrees of flattening, with the black, blue, and red curves corresponding to t = 15 s, 40 s, and 105 s in (A). Confocal x-y scans are shown for a cAR1-GFP cell (C) before and (D) during flattening. (E, F) show the corresponding x-z sections. The blue lines in (C, D) show the y-values for the sections (E, F), and the blue lines in (E, F) show the z-value of images (C, D). Scale bar: 10 μm.
References
-
- Alon U. An Introduction to Systems Biology. Chapman and Hall/CRC; 2006.
-
- Kitanishiyumura T, Fukui Y. Cell Motility and the Cytoskeleton. 1987. pp. 106–117. - DOI
-
- Kessin RH. Dictyostelium: evolution, cell biology, and the development of multicellularity. Cambridge University Press, Cambridge, UK; 2001.
LinkOut - more resources
Full Text Sources
Other Literature Sources
Research Materials
Miscellaneous
