. 2010 Apr 16;141(2):280-9.
doi: 10.1016/j.cell.2010.02.026.

Mitochondrial fusion is required for mtDNA stability in skeletal muscle and tolerance of mtDNA mutations

Affiliations

Mitochondrial fusion is required for mtDNA stability in skeletal muscle and tolerance of mtDNA mutations

Hsiuchen Chen et al. Cell. .

Abstract

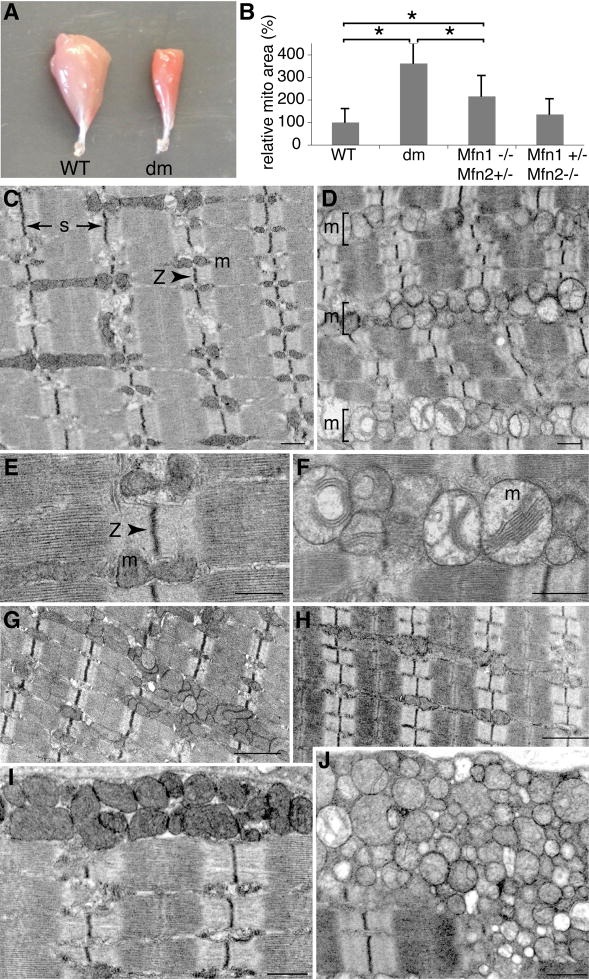
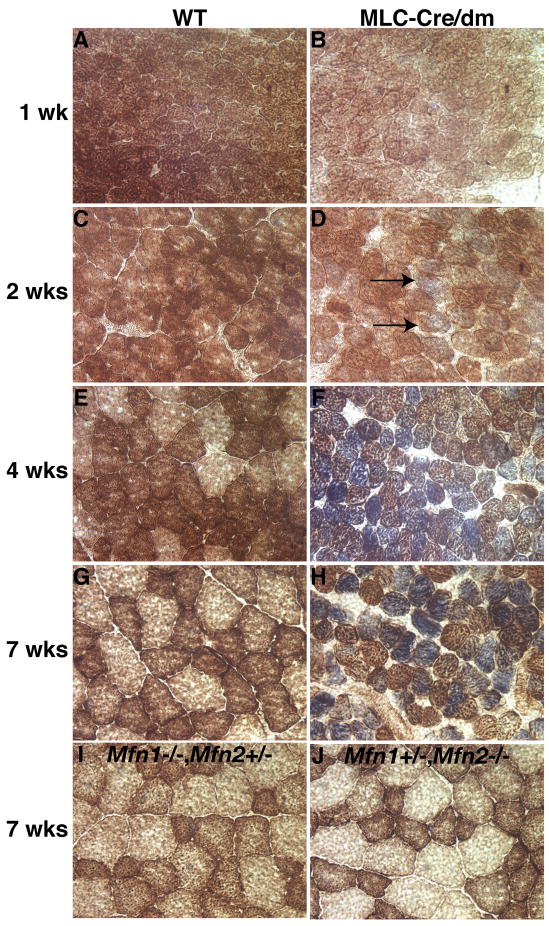
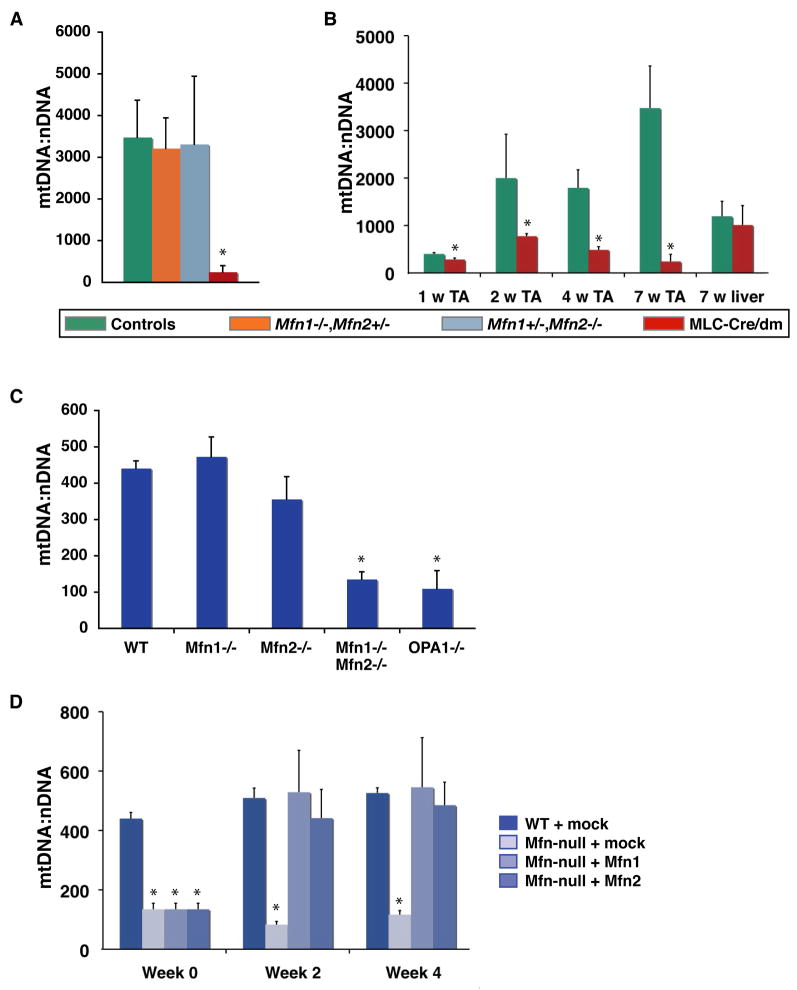
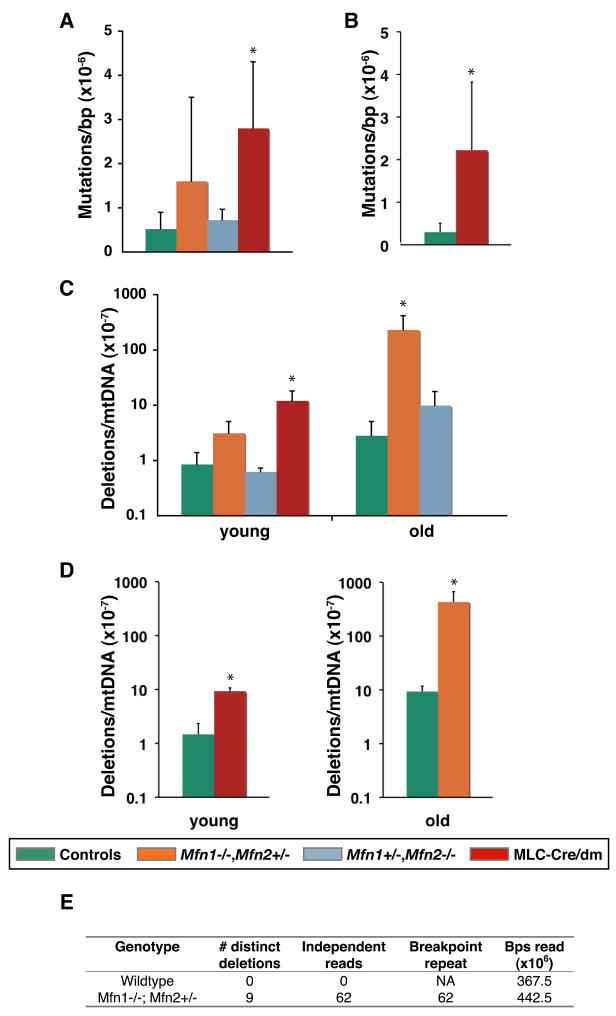
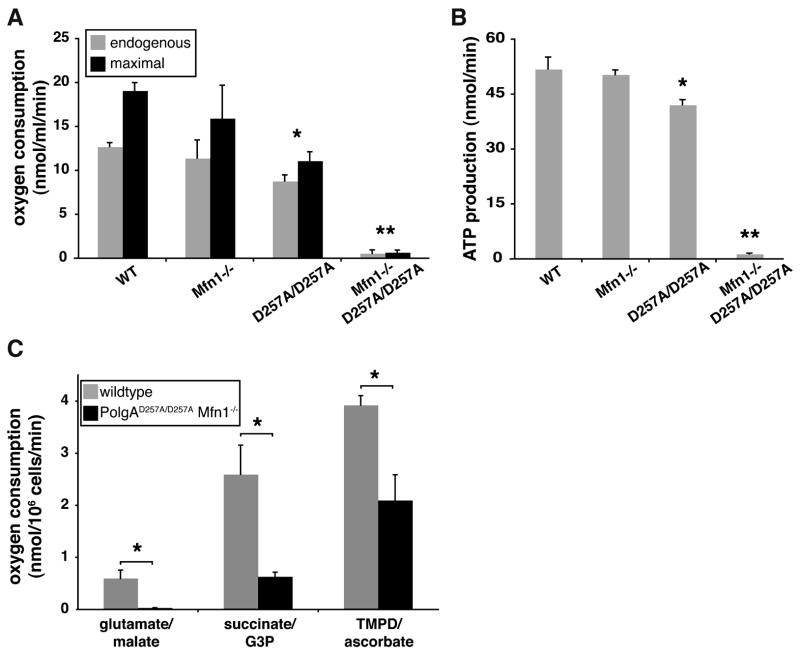
Mitochondria are highly mobile and dynamic organelles that continually fuse and divide. These processes allow mitochondria to exchange contents, including mitochondrial DNA (mtDNA). Here we examine the functions of mitochondrial fusion in differentiated skeletal muscle through conditional deletion of the mitofusins Mfn1 and Mfn2, mitochondrial GTPases essential for fusion. Loss of the mitofusins causes severe mitochondrial dysfunction, compensatory mitochondrial proliferation, and muscle atrophy. Mutant mice have severe mtDNA depletion in muscle that precedes physiological abnormalities. Moreover, the mitochondrial genomes of the mutant muscle rapidly accumulate point mutations and deletions. In a related experiment, we find that disruption of mitochondrial fusion strongly increases mitochondrial dysfunction and lethality in a mouse model with high levels of mtDNA mutations. With its dual function in safeguarding mtDNA integrity and preserving mtDNA function in the face of mutations, mitochondrial fusion is likely to be a protective factor in human disorders associated with mtDNA mutations.


Figures

Figure 1
Figure 1. Mitochondrial defects in 7 week old MLC-Cre/dm muscle
(A) Whole-mount gastrocnemius muscles. The double mutant muscle (right) is smaller and deeper red. (B) Quantification of mitochondrial area in muscle of the indicated genotypes. The area occupied by mitochondria was measured from at least 10 representative EM fields and normalized to the area occupied by mitochondria in wildtype muscle. Asterisks (P<0.0003, unpaired t-test) indicate significant changes. (C–J) Electron microscopy of tibialis anterior (TA) longitudinal sections. Labels: s, length of sarcomere; Z, Z-disc; m, mitochondria. (C, E, and I) Wildtype. (D, F, and J) Mfn double mutant. (G) Mfn1−/−, Mfn2+/−. (H) Mfn1+/−, Mfn2−/−. (I and J) Subsarcolemmal mitochondria. Scale bars: 0.5 μm in C–F, I and J; 1μm in G and H. See also Figure S1.
Figure 2
Figure 2. Temporal analysis of respiratory deficiency in MLC-Cre/dm muscle
Transverse sections of TA muscle were stained histochemically for COX (brown) and SDH (blue) activity. (A, C, E, and G) Wildtype muscle. (B, D, F, and H) Double mutant muscle. Blue staining is indicative of mitochondrial dysfunction. Note the initial appearance of faintly blue fibers in D (arrows) and deeply blue fibers in F and H. The ages of the samples are indicated. (I and J) Genotypes and age of the muscles are indicated. 400× magnification. See also Figure S2.
Figure 3
Figure 3. Quantitative analysis of mtDNA from muscle and MEFs
(A) Analysis of mtDNA copy number per nuclear genome in 7–8 week TA muscle. Controls include wildtype, Mfn1+/−, and Mfn2+/− littermates of the double mutants. P=0.0002. (B) Temporal analysis of mtDNA depletion in double mutant TA muscle. Ages of the samples are indicated. P<0.008. Legend indicates genotypes for (A) and (B). (C) Mitochondrial copy number in MEFs. Genotypes are indicated. P<0.0001. (D) Restoration of mtDNA levels in Mfn double null cells. MtDNA levels were measured in mutant cells infected with retrovirus expressing mito-DsRed (mock), Mfn1 or Mfn2. Mitochondria were analyzed 2 and 4 weeks after infection. P<0.0001. In all panels, asterisks denote statistically significant changes from control, and error bars indicate standard deviations from 3–5 animals or experiments. To obtain the mtDNA level for a single DNA sample, quantitative PCR was performed in quadruplicate. P-values were obtained from unpaired t-tests. See also Figure S3.
Figure 4
Figure 4. Quantitative analysis of mtDNA mutations
(A–D) Quantification of mtDNA mutations in TA muscle by the random mutation capture assay. Legend for genotypes applies to panels A–D. Error bars indicate standard deviations from 3–5 animals. Asterisks denote statistically significant changes from control. P-values were obtained from unpaired t-tests. (A, B) Quantification of point mutation frequency per basepair at two independent sites. P=0.03 in (A); P=0.05 in (B). (C, D) Quantification of deletion frequency per mtDNA genome at two independent sites. In (C), P=0.01 for young muscle (7–8 weeks), and P=0.02 for old muscle (8–13 months). In (D), P=0.0003 for young muscle, and P=0.04 for old muscle. In total, approximately 250 million basepairs were screened for point mutations, and 700 million genomes for deletion. (E) Tabulation of mtDNA deletion events from Solexa sequencing of mtDNA from 10-month skeletal muscle of the indicated genotypes. “Breakpoint repeat” indicates the number of deletions involving direct repeats of 6–14 basepairs. See also Figure S4 and Table S1.
Figure 5
Figure 5. Oxygen polarography and ATP production in MEFs
(A) Respiration rates of MEFs of the indicated genotypes. Endogenous respiration is the oxygen consumption rate of untreated cells, and maximal respiration is the oxygen consumption rate after addition of the uncoupler dinitrophenol. Standard deviations from 3 experiments are shown. (B) ATP production via Complex I. ATP production was measured using a luciferase-based assay on 1×10⁶ permeabilized cells. Standard deviations from 3 experiments are indicated. (C) Substrate-driven respiration rates of MEFs of the indicated genotypes. Oxygen consumption rates driven by the substrates glutamate/malate (Complex I), succinate/G3P (Complex III), and TMPD/ascorbate (Complex IV) were measured. Standard deviations from 2 experiments are shown. In all panels, single asterisks (P<0.05) and double asterisks (P<0.01) represent significant changes compared to wildtype. See also Figures S5.

Comment in

  • Organelle dynamics: Fusing for stability.
    Baumann K. Baumann K. Nat Rev Mol Cell Biol. 2010 Jun;11(6):391. doi: 10.1038/nrm2910. Epub 2010 May 12. Nat Rev Mol Cell Biol. 2010. PMID: 20461095 No abstract available.

Similar articles

Cited by

References

    1. Detmer SA, Chan DC. Functions and dysfunctions of mitochondrial dynamics. Nat Rev Mol Cell Biol. 2007a;8:870–879. - PubMed
    1. Suen DF, Norris KL, Youle RJ. Mitochondrial dynamics and apoptosis. Genes Dev. 2008;22:1577–1590. - PMC - PubMed
    1. Okamoto K, Shaw JM. Mitochondrial morphology and dynamics in yeast and multicellular eukaryotes. Annu Rev Genet. 2005;39:503–536. - PubMed
    1. Hoppins S, Lackner L, Nunnari J. The machines that divide and fuse mitochondria. Annu Rev Biochem. 2007;76:751–780. - PubMed
    1. Koshiba T, Detmer SA, Kaiser JT, Chen H, McCaffery JM, Chan DC. Structural basis of mitochondrial tethering by mitofusin complexes. Science. 2004;305:858–862. - PubMed

Publication types

LinkOut - more resources