

Proteomic analysis of anoxia tolerance in the developing zebrafish embryo
- PMID: 20403745
- PMCID: PMC2858231
- DOI: 10.1016/j.cbd.2008.09.003
Proteomic analysis of anoxia tolerance in the developing zebrafish embryo
Abstract
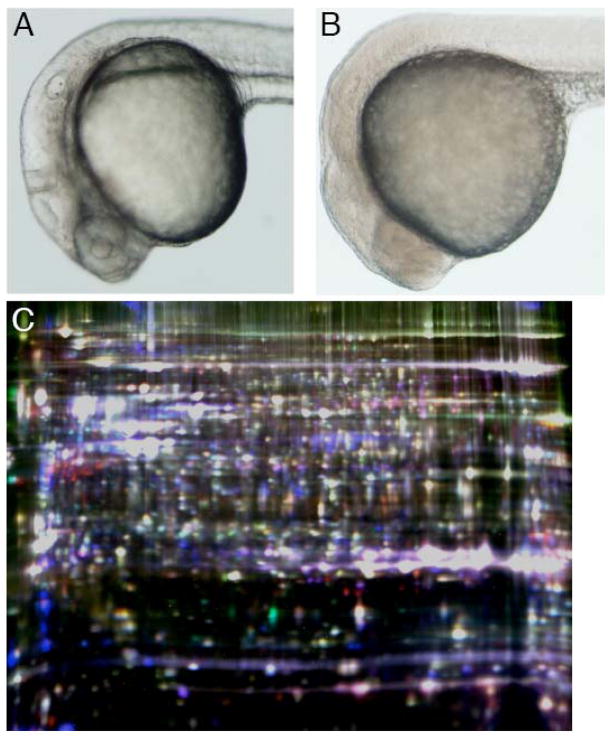
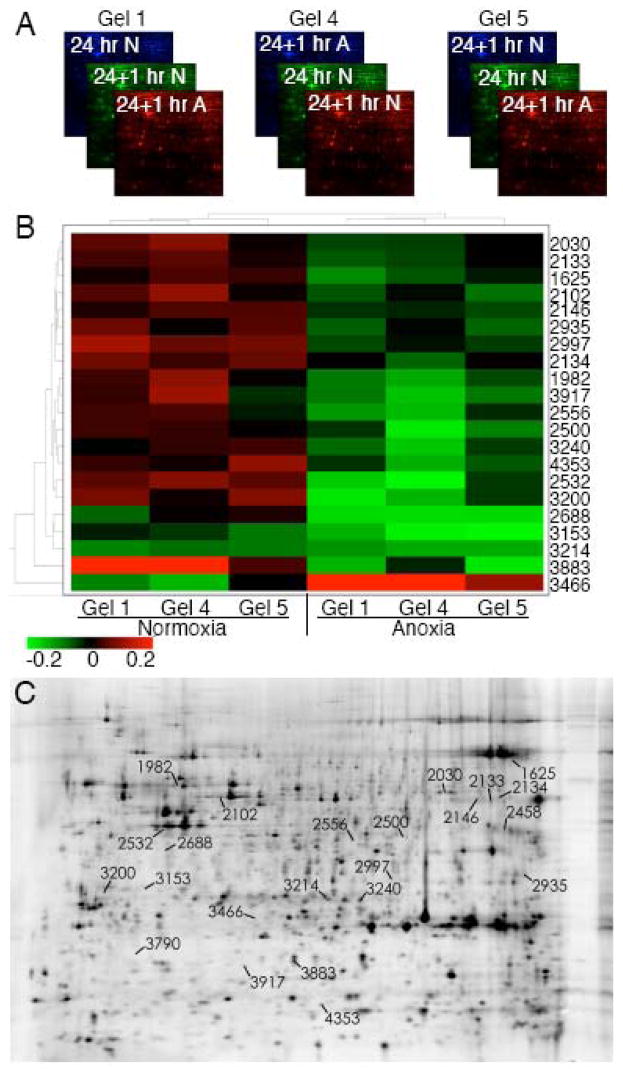
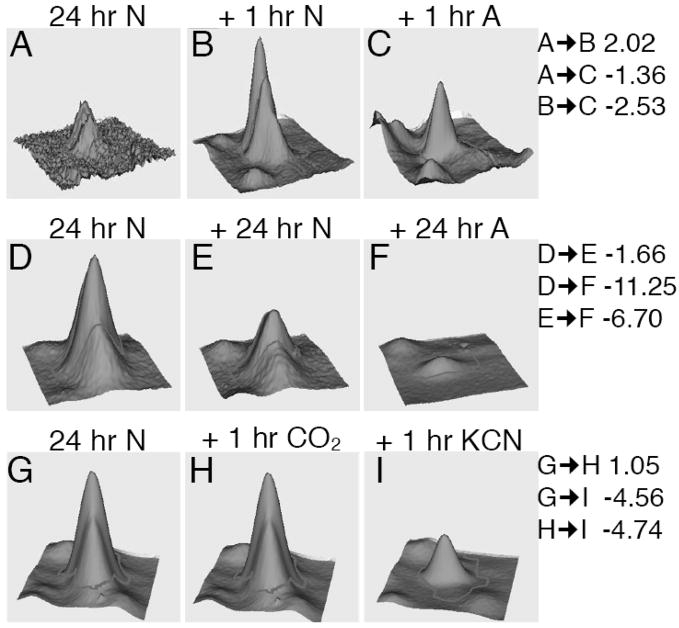
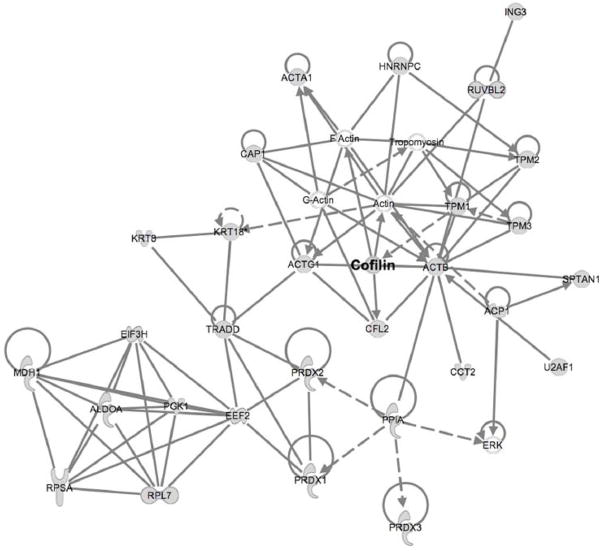
While some species and tissue types are injured by oxygen deprivation, anoxia tolerant organisms display a protective response that has not been fully elucidated and is well-suited to genomic and proteomic analysis. However, such methodologies have focused on transcriptional responses, prolonged anoxia, or have used cultured cells or isolated tissues. In this study of intact zebrafish embryos, a species capable of >24 h survival in anoxia, we have utilized 2D difference in gel electrophoresis to identify changes in the proteomic profile caused by near-lethal anoxic durations as well as acute anoxia (1 h), a timeframe relevant to ischemic events in human disease when response mechanisms are largely limited to post-transcriptional and post-translational processes. We observed a general stabilization of the proteome in anoxia. Proteins involved in oxidative phosphorylation, antioxidant defense, transcription, and translation changed over this time period. Among the largest proteomic alterations was that of muscle cofilin 2, implicating the regulation of the cytoskeleton and actin assembly in the adaptation to acute anoxia. These studies in an intact embryo highlight proteomic components of an adaptive response to anoxia in a model organism amenable to genetic analysis to permit further mechanistic insight into the phenomenon of anoxia tolerance.
Keywords: Anoxia; proteomic; zebrafish.
Figures
References
-
- Alban A, David SO, Bjorkesten L, Andersson C, Sloge E, Lewis S, Currie I. A novel experimental design for comparative two-dimensional gel analysis: two-dimensional difference gel electrophoresis incorporating a pooled internal standard. Proteomics. 2003;3:36–44. - PubMed
-
- Bernstein BW, Chen H, Boyle JA, Bamburg JR. Formation of actin-ADF/cofilin rods transiently retards decline of mitochondrial potential and ATP in stressed neurons. Am J Physiol. 2006;291:C828–839. - PubMed
-
- Bickler PE, Buck LT. Hypoxia tolerance in reptiles, amphibians, and fishes: life with variable oxygen availability. Annu Rev Physiol. 2007;69:145–170. - PubMed
-
- Bosworth CAt, Chou CW, Cole RB, Rees BB. Protein expression patterns in zebrafish skeletal muscle: initial characterization and the effects of hypoxic exposure. Proteomics. 2005;5:1362–1371. - PubMed
Grants and funding
LinkOut - more resources
Full Text Sources
