

US pharmaceutical innovation in an international context
- PMID: 20403883
- PMCID: PMC2866602
- DOI: 10.2105/AJPH.2009.178491
US pharmaceutical innovation in an international context
Abstract
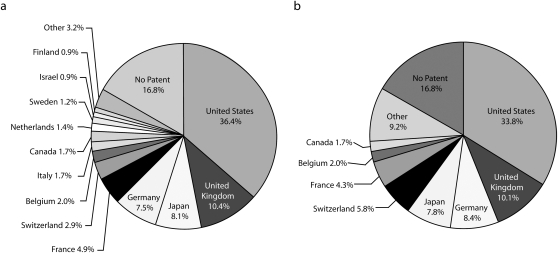
Objectives: We explored whether the United States, which does not regulate pharmaceutical prices, is responsible for the development of a disproportionate share of the new molecular entities (NMEs; a drug that does not contain an active moiety previously approved by the Food and Drug Administration) produced worldwide.
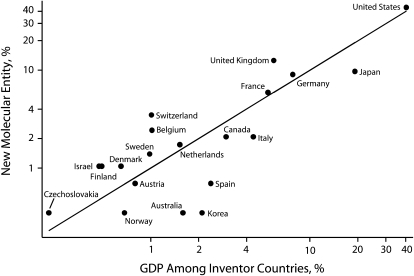
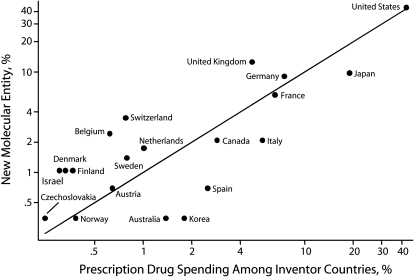
Methods: We collected data on NMEs approved between 1992 and 2004 and assigned each NME to an inventor country. We examined the relation between the proportion of total NMEs developed in each country and the proportion of total prescription drug spending and gross domestic product (GDP) of each country represented.
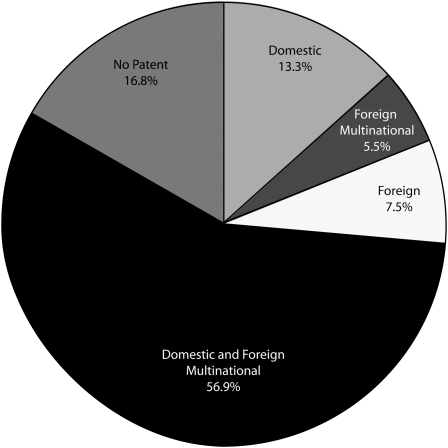
Results: The United States accounted for 42% of prescription drug spending and 40% of the total GDP among innovator countries and was responsible for the development of 43.7% of the NMEs. The United Kingdom, Switzerland, and a few other countries innovated proportionally more than their contribution to GDP or prescription drug spending, whereas Japan, South Korea, and a few other countries innovated less.
Conclusions: Higher prescription drug spending in the United States does not disproportionately privilege domestic innovation, and many countries with drug price regulation were significant contributors to pharmaceutical innovation.
Figures
Similar articles
-
Higher US branded drug prices and spending compared to other countries may stem partly from quick uptake of new drugs.Health Aff (Millwood). 2013 Apr;32(4):753-61. doi: 10.1377/hlthaff.2012.0920. Health Aff (Millwood). 2013. PMID: 23569056
-
Scale and scope in drug development: unpacking the advantages of size in pharmaceutical research.J Health Econ. 2001 Nov;20(6):1033-57. doi: 10.1016/s0167-6296(01)00108-4. J Health Econ. 2001. PMID: 11758047
-
International health care spending.Health Aff (Millwood). 1986 Fall;5(3):111-22. doi: 10.1377/hlthaff.5.3.111. Health Aff (Millwood). 1986. PMID: 3098657
-
The High Cost of Prescription Drugs in the United States: Origins and Prospects for Reform.JAMA. 2016 Aug 23-30;316(8):858-71. doi: 10.1001/jama.2016.11237. JAMA. 2016. PMID: 27552619 Review.
-
Returns to R&D on new drug introductions in the 1980s.J Health Econ. 1994 Dec;13(4):383-406. doi: 10.1016/0167-6296(94)90010-8. J Health Econ. 1994. PMID: 10140531 Review.
Cited by
-
Estimating the Cost of Industry Investment in Drug Research and Development: A Review of Methods and Results.Inquiry. 2021 Jan-Dec;58:469580211059731. doi: 10.1177/00469580211059731. Inquiry. 2021. PMID: 35170336 Free PMC article. Review.
-
Gene therapies development: slow progress and promising prospect.J Mark Access Health Policy. 2017 Jan 3;5(1):1265293. doi: 10.1080/20016689.2017.1265293. eCollection 2017. J Mark Access Health Policy. 2017. PMID: 28265348 Free PMC article.
-
A Proposal to Increase Value and Equity in the Development and Distribution of New Pharmaceuticals.Int J Health Serv. 2022 Jul;52(3):363-371. doi: 10.1177/00207314221100647. Epub 2022 May 12. Int J Health Serv. 2022. PMID: 35546103 Free PMC article.
-
Structural Comparison of Diverse HIV-1 Subtypes using Molecular Modelling and Docking Analyses of Integrase Inhibitors.Viruses. 2020 Aug 26;12(9):936. doi: 10.3390/v12090936. Viruses. 2020. PMID: 32858802 Free PMC article.
-
It Takes a Village…: Contending With Drug Shortages During Disasters.Chest. 2020 Dec;158(6):2414-2424. doi: 10.1016/j.chest.2020.08.015. Epub 2020 Aug 14. Chest. 2020. PMID: 32805237 Free PMC article. Review.
References
-
- Kyle M. Pharmaceutical price controls and entry strategy. Rev Econ Stat 2007;89(1):88–99
-
- Foreign Government Pharmaceutical Price and Access Controls Washington, DC: Pharmaceutical Research and Manufacturers of America (prepared for the Dept of Commerce); 2004
-
- PhRMA Statement regarding benefits of US innovation [news release]. Available at: http://www.phrma.org/news_room/press_releases/phrma_statement_regarding_.... Accessed September 7, 2009
-
- International Trade and Pharmaceuticals Subcommittee on Health Care and Subcommittee on International Trade, Committee on Finance, United States Senate, April 27, 2004 (testimony of William K. Hubbard, Associate Commissioner for Policy and Planning, Food and Drug Administration). Washington, DC: US Department of Health and Human Services; 2004
Publication types
MeSH terms
Substances
LinkOut - more resources
Full Text Sources
