

Airway mast cells in a rhesus model of childhood allergic airways disease
- PMID: 20403968
- PMCID: PMC2886865
- DOI: 10.1093/toxsci/kfq119
Airway mast cells in a rhesus model of childhood allergic airways disease
Abstract
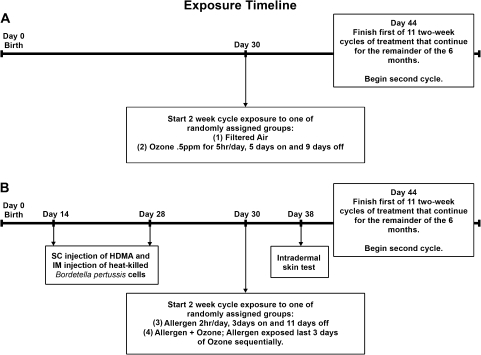
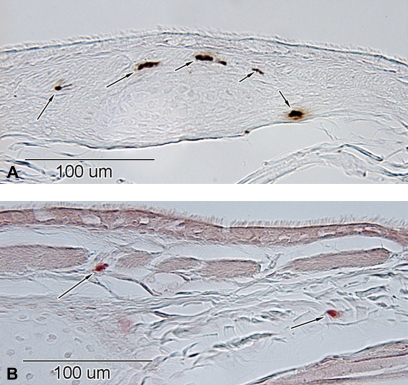
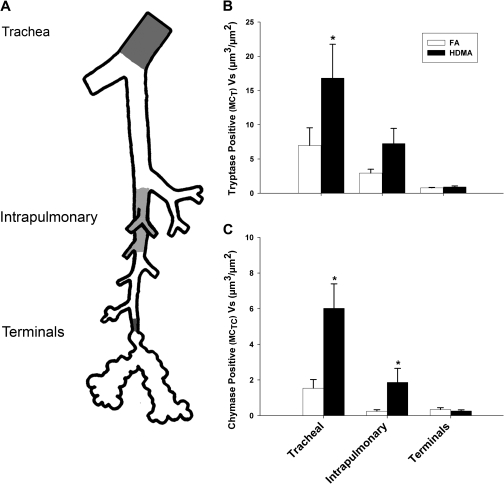
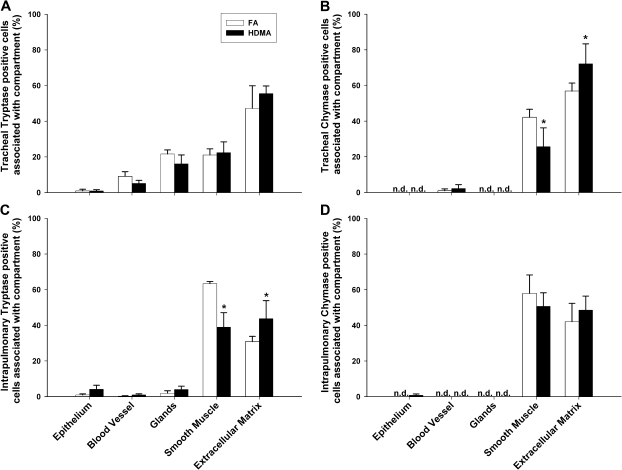
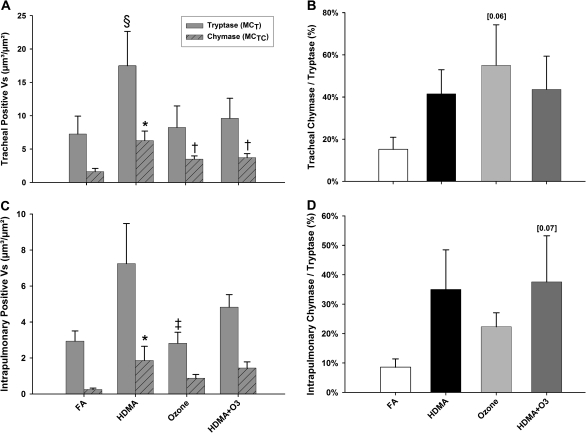
Asthma is a leading cause of morbidity in children. Risk factors include chronic exposure to allergens and air pollution. While chronically activated mast cells contribute to the pathophysiology of asthma in part through their proteases such as chymase and tryptase, previous studies of airway mast cell abundance and distribution in asthmatics have been inconsistent. To determine whether repeated episodic exposures to environmental pollutants during postnatal lung development alter airway mast cell abundance and distribution, we exposed infant rhesus monkeys to a known human allergen, house dust mite antigen (HDMA), and/or a known environmental pollutant, ozone (O(3)), and quantitatively compared the abundance of tryptase- or chymase-positive mast cells in three airway levels. Mast cells are resident in multiple compartments of the airway wall in infant rhesus monkeys raised from birth in filtered air. Tryptase- and chymase-positive cells were most abundant in trachea and least in terminal bronchioles. The majority of tryptase-positive and almost all chymase-positive cells were in extracellular matrix and smooth muscle bundles. Chronic exposure to HDMA elevated the abundance of both tryptase- and chymase-positive cells in the trachea and intrapulmonary bronchi. Neither exposure to O(3) nor HDMA + O(3) increased mast cell accumulations in the airway wall. We conclude that during postnatal airway development (1) mast cells are a resident airway cell population even in the absence of toxic air contaminants; (2) aeroallergen exposure alters large airway mast cell distribution and abundance, increasing chymase-positive mast cells; and (3) this response is attenuated by exposure to oxidant air pollutants.
Figures
Similar articles
-
Asthma/allergic airways disease: does postnatal exposure to environmental toxicants promote airway pathobiology?Toxicol Pathol. 2007 Jan;35(1):97-110. doi: 10.1080/01926230601132030. Toxicol Pathol. 2007. PMID: 17325978
-
Postnatal remodeling of the neural components of the epithelial-mesenchymal trophic unit in the proximal airways of infant rhesus monkeys exposed to ozone and allergen.Toxicol Appl Pharmacol. 2004 Feb 1;194(3):211-20. doi: 10.1016/j.taap.2003.09.025. Toxicol Appl Pharmacol. 2004. PMID: 14761677
-
Smooth muscle hypertrophy in distal airways of sensitized infant rhesus monkeys exposed to house dust mite allergen.Clin Exp Allergy. 2004 Oct;34(10):1627-33. doi: 10.1111/j.1365-2222.2004.02057.x. Clin Exp Allergy. 2004. PMID: 15479280
-
The role of the mast cell in the pathophysiology of asthma.J Allergy Clin Immunol. 2006 Jun;117(6):1277-84. doi: 10.1016/j.jaci.2006.02.039. Epub 2006 Apr 27. J Allergy Clin Immunol. 2006. PMID: 16750987 Review.
-
Development, significance, and heterogeneity of mast cells with particular regard to the mast cell-specific proteases chymase and tryptase.J Leukoc Biol. 1997 Mar;61(3):233-45. doi: 10.1002/jlb.61.3.233. J Leukoc Biol. 1997. PMID: 9060446 Review.
Cited by
-
Use of nonhuman primates in obstructive lung disease research - is it required?Primate Biol. 2017 Jun 30;4(1):131-142. doi: 10.5194/pb-4-131-2017. eCollection 2017. Primate Biol. 2017. PMID: 32110701 Free PMC article. Review.
-
Mast cell-derived neurotrophin 4 mediates allergen-induced airway hyperinnervation in early life.Mucosal Immunol. 2016 Nov;9(6):1466-1476. doi: 10.1038/mi.2016.11. Epub 2016 Feb 10. Mucosal Immunol. 2016. PMID: 26860818 Free PMC article.
-
Biochemical effects of ozone on asthma during postnatal development.Biochim Biophys Acta. 2011 Nov;1810(11):1114-9. doi: 10.1016/j.bbagen.2011.01.008. Epub 2011 Jan 27. Biochim Biophys Acta. 2011. PMID: 21276837 Free PMC article. Review.
-
Lung gene expression in a rhesus allergic asthma model correlates with physiologic parameters of disease and exhibits common and distinct pathways with human asthma and a mouse asthma model.Am J Pathol. 2011 Oct;179(4):1667-80. doi: 10.1016/j.ajpath.2011.06.009. Epub 2011 Aug 3. Am J Pathol. 2011. PMID: 21819959 Free PMC article.
-
Increased CCL24/eotaxin-2 with postnatal ozone exposure in allergen-sensitized infant monkeys is not associated with recruitment of eosinophils to airway mucosa.Toxicol Appl Pharmacol. 2011 Dec 15;257(3):309-18. doi: 10.1016/j.taap.2011.09.001. Epub 2011 Sep 12. Toxicol Appl Pharmacol. 2011. PMID: 21945493 Free PMC article.
References
-
- American Lung Association (ALA) 2009 In Trends in asthma morbidity and mortality January 2009 (R. a. P.S.D. Epidemiology and Statistics Unit, Eds.), pp. 4–9, 37–43. American Lung Association, Washington, DC. Available at: http://www.lungusa.org/finding-cures/for-professionals/asthma-trend-repo....
-
- Anderson DF, Zhang S, Bradding P, McGill JI, Holgate ST, Roche WR. The relative contribution of mast cell subsets to conjunctival TH2-like cytokines. Invest. Ophthalmol. Vis. Sci. 2001;42:995–1001. - PubMed
-
- Balzar S, Chu HW, Strand M, Wenzel S. Relationship of small airway chymase-positive mast cells and lung function in severe asthma. Am. J. Respir. Crit. Care Med. 2005;171:431–439. - PubMed
-
- Beasley R, Roche WR, Roberts JA, Holgate ST. Cellular events in the bronchi in mild asthma and after bronchial provocation. Am. Rev. Respir. Dis. 1989;139:806–817. - PubMed
Publication types
MeSH terms
Grants and funding
LinkOut - more resources
Full Text Sources
Medical
