

Optimal processing of photoreceptor signals is required to maximize behavioural sensitivity
- PMID: 20403975
- PMCID: PMC2901982
- DOI: 10.1113/jphysiol.2010.188573
Optimal processing of photoreceptor signals is required to maximize behavioural sensitivity
Abstract
The sensitivity of receptor cells places a fundamental limit upon the sensitivity of sensory systems. For example, the signal-to-noise ratio of sensory receptors has been suggested to limit absolute thresholds in the visual and auditory systems. However, the necessity of optimally processing sensory receptor signals for behaviour to approach this limit has received less attention. We investigated the behavioural consequences of increasing the signal-to-noise ratio of the rod photoreceptor single-photon response in a transgenic mouse, the GCAPs-/- knockout. The loss of fast Ca2+ feedback to cGMP synthesis in phototransduction for GCAPs-/- mice increases the magnitude of the rod single-photon response and dark noise, with the increase in size of the single-photon response outweighing the increase in noise. Surprisingly, despite the increased rod signal-to-noise ratio, behavioural performance for GCAPs-/- mice was diminished near absolute visual threshold. We demonstrate in electrophysiological recordings that the diminished performance compared to wild-type mice is explained by poorly tuned postsynaptic processing of the rod single-photon response at the rod bipolar cell. In particular, the level of postsynaptic saturation in GCAPs-/- rod bipolar cells is not sufficient to eliminate rod noise, and degrades the single-photon response signal-to-noise ratio. Thus, it is critical for retinal processing to be optimally tuned near absolute threshold; otherwise the visual system fails to utilize fully the signals present in the rods.
Figures


 ,
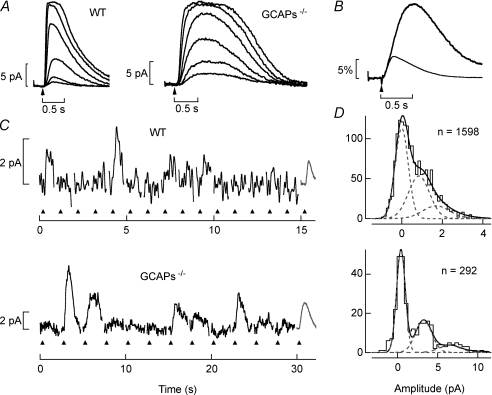
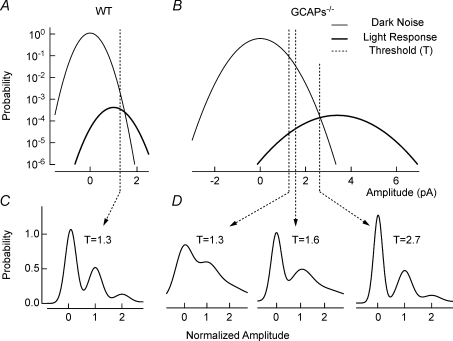
,  ). The dashed vertical lines indicate the position of the non-linear threshold, plotted at 1.3 for WT (Field & Rieke, 2002b). B, the probability density for GCAPs−/− rods near absolute visual threshold, as for WT rods. Gaussian distributions were averaged and have been normalized to the mean single-photon response amplitude (
 ,
,  ) that were multiplied by 3.4-fold difference in the mean single-photon response amplitude compared to WT rods (see Fig. 1). Non-linear thresholds were plotted at 1.3 (same as WT), 1.6 and 2.7 pA. C and D, rod bipolar response distributions were simulated assuming the convergence of 20 rods per rod bipolar cell and flash strengths of 0.1 Rh*/rod and 0.04 Rh*/rod for WT and GCAPs−/− distributions, respectively. We assumed a sharp threshold, where responses exceeding the threshold were transmitted and those below the threshold were scaled by 0.15, to reproduce the observed variance in dark noise of the rod bipolar cells in Fig. 4. Simulated histograms resulting from 10,000 repeated flashes were fitted as the sum of Gaussian distributions centred at the absorption of 0, 1, 2 … photons (see Methods), and the response amplitude axis was normalized to the mean single-photon response amplitude.
References
Publication types
MeSH terms
Substances
Grants and funding
LinkOut - more resources
Full Text Sources
Other Literature Sources
Molecular Biology Databases
Miscellaneous