Insulin-like growth factor 2 expression modulates Taxol resistance and is a candidate biomarker for reduced disease-free survival in ovarian cancer
- PMID: 20404007
- PMCID: PMC2887721
- DOI: 10.1158/1078-0432.CCR-09-3233
Insulin-like growth factor 2 expression modulates Taxol resistance and is a candidate biomarker for reduced disease-free survival in ovarian cancer
Abstract
Purpose: This study was undertaken to examine the role of the insulin-like growth factor (IGF) signaling pathway in the response of ovarian cancer cells to Taxol and to evaluate the significance of this pathway in human epithelial ovarian tumors.
Experimental design: The effect of Taxol treatment on AKT activation in A2780 ovarian carcinoma cells was evaluated using antibodies specific for phospho-AKT. To study the drug-resistant phenotype, we developed a Taxol-resistant cell line, HEY-T30, derived from HEY ovarian carcinoma cells. IGF2 expression was measured by real-time PCR. A type 1 IGF receptor (IGF1R) inhibitor, NVP-AEW541, and IGF2 small interfering RNA were used to evaluate the effect of IGF pathway inhibition on proliferation and Taxol sensitivity. IGF2 protein expression was evaluated by immunohistochemistry in 115 epithelial ovarian tumors and analyzed in relation to clinical/pathologic factors using the chi(2) or Fisher's exact tests. The influence of IGF2 expression on survival was studied with Cox regression.
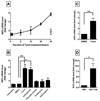
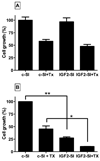
Results: Taxol-induced AKT phosphorylation required IGF1R tyrosine kinase activity and was associated with upregulation of IGF2. Resistant cells had higher IGF2 expression compared with sensitive cells, and IGF pathway inhibition restored sensitivity to Taxol. High IGF2 tumor expression correlated with advanced stage (P < 0.001) and tumor grade (P < 0.01) and reduced disease-free survival (P < 0.05).
Conclusions: IGF2 modulates Taxol resistance, and tumor IGF2 expression is a candidate prognostic biomarker in epithelial ovarian tumors. IGF pathway inhibition sensitizes drug-resistant ovarian carcinoma cells to Taxol. Such novel findings suggest that IGF2 represents a therapeutic target in ovarian cancer, particularly in the setting of Taxol resistance.
Copyright 2010 AACR.
Conflict of interest statement
Figures


Similar articles
-
Insulin-like growth factor 2 silencing restores taxol sensitivity in drug resistant ovarian cancer.PLoS One. 2014 Jun 16;9(6):e100165. doi: 10.1371/journal.pone.0100165. eCollection 2014. PLoS One. 2014. PMID: 24932685 Free PMC article.
-
[Reverse of the resistance to paclitaxel of the heparin binding-epidermal growth factor-like growth factor inhibitor in ovarian cancer].Zhonghua Fu Chan Ke Za Zhi. 2017 Feb 25;52(2):110-115. doi: 10.3760/cma.j.issn.0529-567X.2017.02.008. Zhonghua Fu Chan Ke Za Zhi. 2017. PMID: 28253574 Chinese.
-
[Expression and significance of heparin binding-epidermal growth factor-like growth factor in paclitaxel-resistant ovarian cancer].Zhonghua Fu Chan Ke Za Zhi. 2014 Jul;49(7):517-22. Zhonghua Fu Chan Ke Za Zhi. 2014. PMID: 25327734 Chinese.
-
Targeting the insulin growth factor receptor 1.Hematol Oncol Clin North Am. 2012 Jun;26(3):527-42, vii-viii. doi: 10.1016/j.hoc.2012.01.004. Epub 2012 Feb 28. Hematol Oncol Clin North Am. 2012. PMID: 22520978 Free PMC article. Review.
-
Inhibition of the insulin-like growth factor-1 receptor (IGF1R) tyrosine kinase as a novel cancer therapy approach.J Med Chem. 2009 Aug 27;52(16):4981-5004. doi: 10.1021/jm9002395. J Med Chem. 2009. PMID: 19610618 Free PMC article. Review. No abstract available.
Cited by
-
Essential Role of DNA Methyltransferase 1-mediated Transcription of Insulin-like Growth Factor 2 in Resistance to Histone Deacetylase Inhibitors.Clin Cancer Res. 2017 Mar 1;23(5):1299-1311. doi: 10.1158/1078-0432.CCR-16-0534. Epub 2016 Aug 31. Clin Cancer Res. 2017. PMID: 27582487 Free PMC article.
-
The Interplay Between Non-coding RNAs and Insulin-Like Growth Factor Signaling in the Pathogenesis of Neoplasia.Front Cell Dev Biol. 2021 Mar 9;9:634512. doi: 10.3389/fcell.2021.634512. eCollection 2021. Front Cell Dev Biol. 2021. PMID: 33768092 Free PMC article. Review.
-
An active IGF-1R-AKT signaling imparts functional heterogeneity in ovarian CSC population.Sci Rep. 2016 Nov 7;6:36612. doi: 10.1038/srep36612. Sci Rep. 2016. PMID: 27819360 Free PMC article.
-
The insulin-like growth factor 1 pathway is a potential therapeutic target for low-grade serous ovarian carcinoma.Gynecol Oncol. 2011 Oct;123(1):13-8. doi: 10.1016/j.ygyno.2011.06.016. Epub 2011 Jul 2. Gynecol Oncol. 2011. PMID: 21726895 Free PMC article.
-
BEECH: a dose-finding run-in followed by a randomised phase II study assessing the efficacy of AKT inhibitor capivasertib (AZD5363) combined with paclitaxel in patients with estrogen receptor-positive advanced or metastatic breast cancer, and in a PIK3CA mutant sub-population.Ann Oncol. 2019 May 1;30(5):774-780. doi: 10.1093/annonc/mdz086. Ann Oncol. 2019. PMID: 30860570 Free PMC article. Clinical Trial.
References
-
- Horwitz SB. Taxol (paclitaxel): mechanisms of action. Ann Oncol. 1994;5 Suppl 6:S3–S6. - PubMed
-
- Rao S, Orr GA, Chaudhary AG, Kingston DG, Horwitz SB. Characterization of the taxol binding site on the microtubule. 2-(m-Azidobenzoyl)taxol photolabels a peptide (amino acids 217–231) of beta-tubulin. J Biol Chem. 1995;270:20235–20238. - PubMed
-
- Schiff PB, Fant J, Horwitz SB. Promotion of microtubule assembly in vitro by taxol. Nature. 1979;277:665–667. - PubMed
-
- Jordan MA, Wilson L. Microtubules as a target for anticancer drugs. Nat Rev Cancer. 2004;4:253–265. - PubMed
Publication types
MeSH terms
Substances
Grants and funding
LinkOut - more resources
Full Text Sources
Medical
Research Materials
Miscellaneous

