. 2010 Jun;30(12):2933-46.
doi: 10.1128/MCB.01478-09. Epub 2010 Apr 19.

Transcriptional activity affects the H3K4me3 level and distribution in the coding region

Affiliations

Transcriptional activity affects the H3K4me3 level and distribution in the coding region

Cindy Yen Okitsu et al. Mol Cell Biol. 2010 Jun.

Abstract

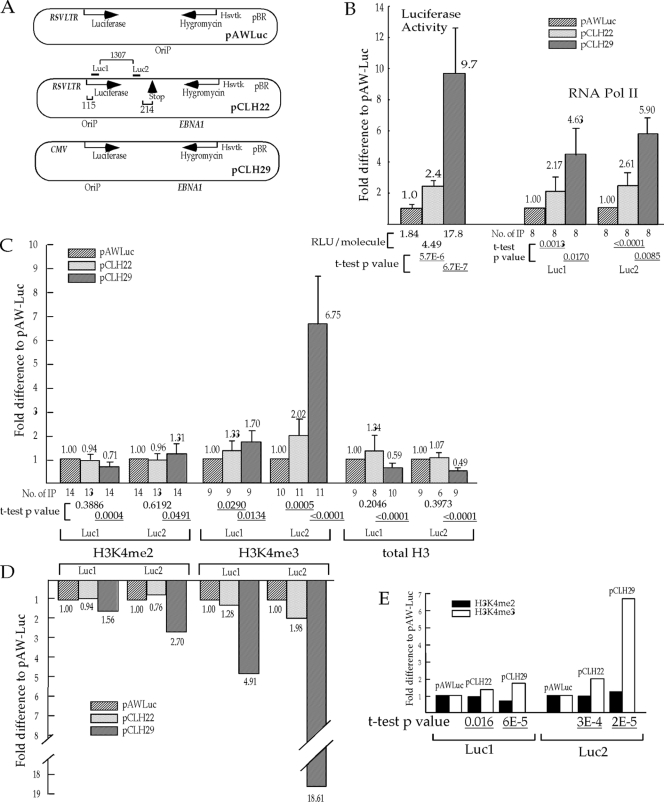
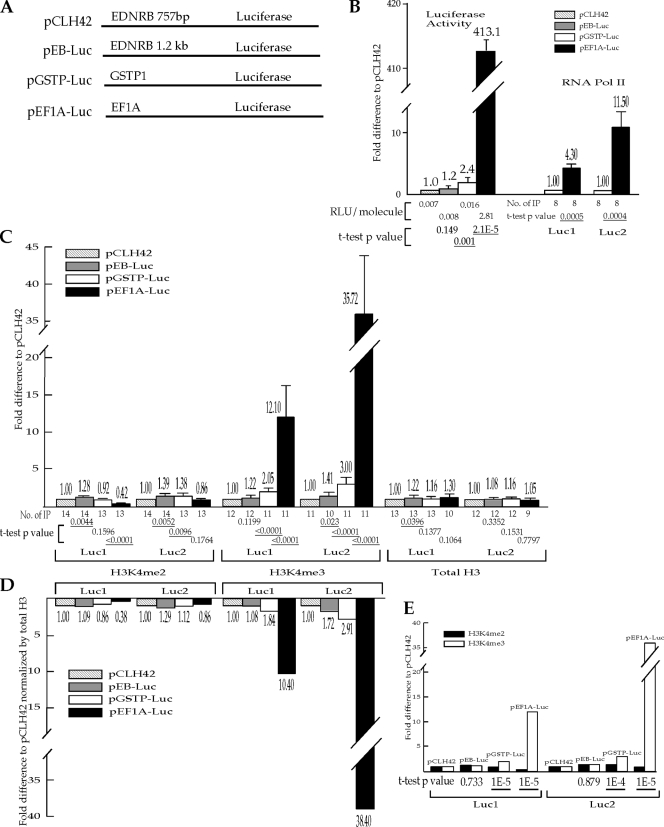
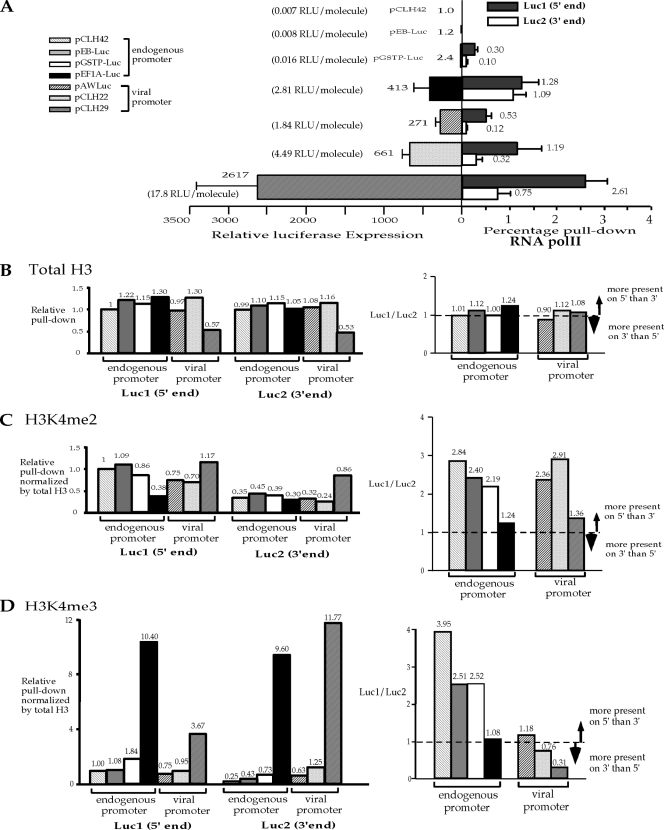
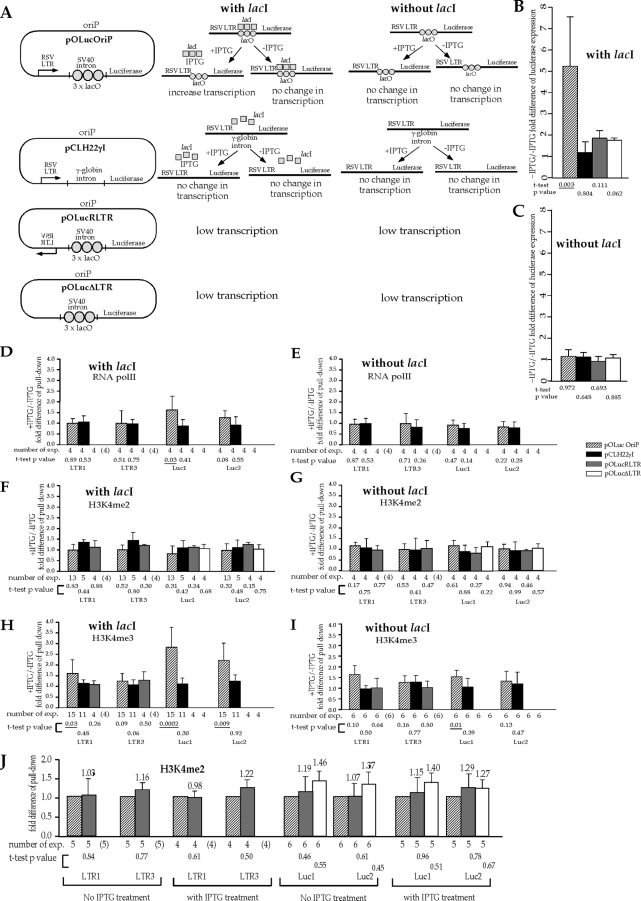
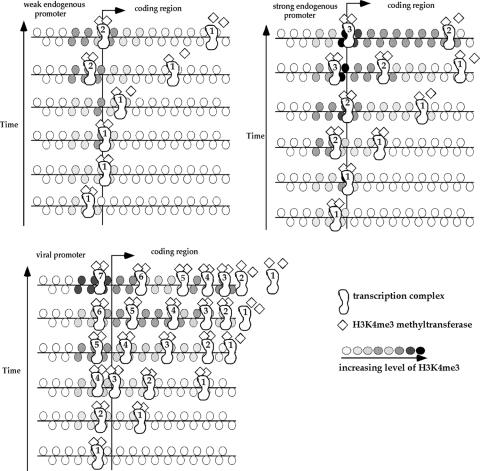
Histone lysine methylation and CpG DNA methylation contribute to transcriptional regulation. We have shown previously that dimethylated and trimethylated forms of histone H3 at lysine 4 (H3K4me2 and H3K4me3) are primarily depleted from CpG-methylated DNA regions by using patch-methylated stable episomes (minichromosomes) in human cells. This effect on H3K4me2 is clearly not linked to the transcriptional activity in the methylated DNA region; however, transcriptional activity may play a role in the presence of H3K4me3. Here, we present clear evidence of the impact of transcriptional activity on the overall level of H3K4me3 in the coding region and the lack of impact on H3K4me2. Our data also demonstrate the influence of transcriptional activity on the distribution of H3K4me3 and H3K4me2, but not that of total H3, in the 5' end of the coding region relative to the 3' end. The nature of the promoter (viral or endogenous) affects H3K4me3 much more than it affects H3K4me2, suggesting a potential fundamental difference in the recruitment of methyltransferase for H3K4 trimethylation.


Figures

FIG. 1.
FIG. 1.
Transcriptional activity influences the level of H3K4me3 much more than the level of H3K4me2 in the coding region. (A) Illustration of the episomes. The two quantitative PCR (Q-PCR) amplicons, Luc1 and Luc2, are marked by bars above the diagram of pCLH22, and the distances (bp) from the transcription start site and the stop codon and between the two amplicons are indicated with brackets and numbers. (B) Relative transcriptional activity as assessed by the luciferase activity and the level of RNA Pol II on the episomes. The luciferase expression of each episome was normalized for the amount of episomal DNA harvested from transfected cells by Q-PCR analysis. Bars represent average relative luciferase expression of each episome from four different experiments with two duplicates (RLU/molecule listed under each relevant bar is calculated from luciferase assays on 6.6 × 10⁶ to 5.7 × 10⁷ molecules of episome in the cell sample) divided by the luciferase expression of pAWLuc. The relative levels of RNA Pol II in the Luc1 and the Luc2 regions of the episomes are shown as the fold difference from the RNA Pol II level of pAWLuc by normalizing the average %IP (calculated as described in Materials and Methods) of the region from each episome against the corresponding value from pAWLuc. (C) The relative levels of H3K4me2, H3K4me3, and total H3 in the Luc1 and the Luc2 regions of the episomes. The relative pull-down of each region was derived as described above for RNA Pol II as a ratio with the corresponding value for pAWLuc. For panels B and C, each bar, with accompanying values, represents the average relative pull-down from a range of 6 to 14 independent IP experiments as listed under each bar. The fold difference from the expression level of pAWLuc is displayed above each bar, and standard deviations are indicated by the error bars. A t test was carried out to test the hypothesis that no significant differences between pCLH29 and pAWLuc and between pCLH22 and pAWLuc could be detected by the assay. The two-tailed P values of the t test are listed under each bar, with the statistically significant P values of <0.05 underlined. (D) H3K4me2 and H3K4me3 levels normalized against the total H3 level. The histogram represents the relative level of each histone modification derived by dividing the average H3K4me2 or H3K4me3 level by the average total H3 level in each of the regions examined on each episome and then normalizing it against the pAWLuc value. Only IP experiments with total H3, H3K4me2, and H3K4me3 are included. The fold differences relative to the expression level of pAWLuc are displayed below each bar. (E) The change in the H3K4me3 level is significantly different from the change in the H3K4me2 level. The histogram shows the same parameters as the corresponding illustration in panel C, but these are grouped by episome instead of histone modification. A t test was carried out to test the hypothesis that there is no difference in the change of the H3K4me2 level and the change of the H3K4me3 level on pCLH22 or on pCLH29. The two-tailed P values of the t test are listed under each bar, with the statistically significant P values of <0.05 underlined. Hsvtk represents the thymidine kinase promoter from herpes simplex virus.
FIG. 2.
FIG. 2.
Transcriptional activity from endogenous promoters on the episomes influences the level of H3K4me3 much more than it influences the level of H3K4me2 in the coding region. (A) Illustration of the promoters on the episomes. These four episomes are identical to pCLH22 except for the promoters used upstream of the luciferase reporter gene as indicated. The two Q-PCR amplicons, Luc1 and Luc2, are the same as indicated in Fig. 1A. (B) Relative transcriptional activity as assessed by the luciferase activity and the level of RNA Pol II on the episomes. The relative reporter gene activity of each episome is calculated as described above but normalized against the corresponding values for pCLH42. The RLU/molecule listed under each relevant bar is calculated from luciferase activity measurements from 5 × 10⁷ to 1.2 × 10⁸ molecules of episome in the cell sample. The percentage of RNA Pol II pulldown was unreliably low for pCLH42 and pEB-Luc; therefore, the relative pulldown of RNA Pol II was derived by normalizing the average %IP of the region from pEF1A-Luc against the corresponding value from pGSTP-Luc. (C) The relative pulldowns of H3K4me2, H3K4me3, and total H3 in the Luc1 and Luc2 regions of the episomes. The relative pulldown of each region is shown as the fold difference from the value for pCLH42. For panels B and C, each bar, with the accompanying value, represents the average relative pulldown from a range of 8 to 14 independent IP experiments as listed under each bar. The fold difference from the value for pCLH42 is displayed on the top of each bar, and the standard deviation is indicated by an error bar. A t test was carried out to test the hypothesis that no significant difference between each episome and pCLH42 could be detected by the specific assay (only differences between pEF1A-Luc and pGSTP-Luc were tested for RNA Pol II pulldown). The two-tailed P values of the t test are listed under each bar, with the statistically significant P values of <0.05 underlined. (D) The average H3K4me2 and H3K4me3 levels normalized against the total H3 level. The histogram represents the level of each histone modification on each episome relative to that of pCLH42 after being normalized for the level of total H3 as described in the legend to Fig. 1. (E) The change in the H3K4me3 level is significantly different from the change in the H3K4me2 level. The histogram shows the same measurements as the corresponding illustration in panel C, but these are grouped by episome instead of histone modification. A t test was carried out to test the hypothesis that there is no difference in the change in H3K4me2 level and the change in the H3K4me3 level on pEF1A-Luc, pGSTP-Luc, or pEB-Luc. The two-tailed P values of the t test are listed under each bar, with the statistically significant P values of <0.05 underlined. The change in transcription on pEB-Luc compared with the change in transcription on pCLH42 as measured by luciferase activity was insignificant; therefore, the lack of a significantly different change in the H3K4me3 level relative to the change in the H3K4me2 level is expected.
FIG. 3.
FIG. 3.
Transcriptional activity affects the distributions of H3K4me2 and H3K4me3 in the coding region. (A) Summary of relative activities of the luciferase reporter gene on all seven episomes and the RNA Pol II pulldowns from five of the seven episomes shown in Fig. 1 and 2. Bars on the left side represent average relative luciferase gene activities after normalization against the pCLH42 value. Bars on the right side represent average percent pulldowns of RNA Pol II in each of the two regions, Luc1 and Luc2. Standard deviations are indicated by the error bars. (B) Transcriptional activity does not have a dramatic impact on total H3 levels or distribution in the reporter coding region. (C) Transcriptional activity changes the distribution of H3K4me2 in the reporter coding region. (D) Transcriptional activity and the promoter influence the distribution of H3K4me3 in the reporter coding region. For panels B, C, and D, the histograms on the left side represent the specific histone levels in two regions (Luc1 and Luc2) of the reporter coding region from each of the seven episomes normalized by the corresponding value in the Luc1 region of pCLH42. The histograms on the right side represent the ratios of specific histone at the 5′ end to specific histone at the 3′ end of the reporter coding region from each of the seven episomes to reflect the distributions of the specific histone at the two ends of the coding region.
FIG. 4.
FIG. 4.
Transcriptional activity has a direct impact on the presence of H3K4me3 in the reporter coding region. exp., experiments. (A) Illustration of the four episomes and the expected and tested effects of IPTG treatment on transcription of the luciferase reporter gene on these episomes in the cells with and without lacI expression. Binding of lacI to the lacO sites positioned between the promoter and the reporter coding region on pOLucOriP interferes with transcription of the luciferase reporter gene, and IPTG treatment would restore transcriptional activity of the luciferase gene on pOLucOriP in lacI-expressing cells but has no effect on pOLucOriP in cells without lacI expression. SV40, simian virus 40. (B) Effect of IPTG treatment on luciferase expression when the episomes are transfected into lacI-expressing cells. pOLucOriP is the only episome whose luciferase expression is significantly affected by the IPTG treatment as expected. (C) Lack of IPTG effect on luciferase expression when the episomes are transfected into cells that do not express lacI. In both panel B and panel C, the luciferase activity is normalized with the amount of episome in the transfected cells as measured by Q-PCR. The normalized luciferase activity of IPTG-treated cells is divided by that of untreated cells harboring the same episome to derive the fold difference of luciferase expression illustrated in the histogram. Each bar represents the average from four independent experiments, and the standard deviations are indicated by error bars. (D) Effect of IPTG treatment on RNA Pol II levels in the coding regions of the episomes in the lacI-expressing cells. (E) Effect of IPTG treatment on RNA Pol II levels in the coding regions of the episomes in cells with no lacI expression. In both panel D and panel E, pOLucRLTR and pOLucΔLTR have only background levels of transcription; therefore, there is no measurable DNA above the background in the Q-PCR of all four regions, reflecting the lack of RNA Pol II. (F) Effect of IPTG treatment on the H3K4me2 level in the coding regions of episomes in lacI-expressing cells. (G) Effect of IPTG treatment on the H3K4me2 level in the coding region of episomes in cells with no lacI expression. (H) Effect of IPTG treatment on the H3K4me3 level in the coding region of episomes in lacI-expressing cells. (I) Effect of IPTG treatment on the H3K4me3 level in the coding region of episomes in cells without lacI expression. In panels F, G, H, and I, there is no measurable DNA above the background for pOLucΔLTR in the Q-PCR of LTR1 and LTR3 regions because this episome does not have the RSV LTR. In panels H and I, there is no measurable DNA from pOLucRLTR and pOLucΔLTR from the H3K4me3 pulldown, reflecting the lack of H3K4me3 in these regions of the episome. The fold differences in pulldowns in panels D, E, F, G, H, and I were derived by dividing the percent pulldown from cells with IPTG treatment by the corresponding value from cells without IPTG treatment. Each bar represents the average of multiple independent pull-down experiments as indicated below the histogram. The number of experiments carried out is shown in parentheses when the DNA sequence was absent from the episome. The standard deviations are indicated by error bars. For panels B to I, a t test was carried out to test the hypothesis that the presence of RNA Pol II or the histone modification does not change with IPTG treatment. P values of the t test are listed under each bar, with statistically significant P values of <0.05 underlined. (J) H3K4me2 presence is not affected by transcriptional activity through the coding region. The levels of H3K4me3 on pOLucRLTR and pLucΔLTR in each of the four regions examined were normalized against that of pOLucOriP. There is no significant difference between pOLucRLTR and pOLucOriP or between pLucΔLTR and pOLucOriP, as indicated by the t test (P value listed under each bar), regardless of IPTG treatment in the lacI-expressing cells. Similar results were found in the cells that do not express lacI (data not shown).
FIG. 5.
FIG. 5.
A proposed model for the influence of transcriptional activity on the H3K4me3 level and H3K4me3 distribution in the coding region. The overall increase in H3K4me3 with increased transcriptional activity in each of the viral and endogenous promoter groups may be a simple consequence of the increased number of transcriptional complexes moving through the coding region. If the dissociation time of the histone methyltransferase from the transcription complex is invariant, then with decreased transcription and increased promoter pause time, the histone methyltransferase will dissociate closer to the 5′ end (leading to the increased ratio of H3K4me3 at the 5′ end relative to that at the 3′ end). The accumulation of transcription complexes at the end of the coding region when an extremely high number of complexes is initiated may lead to the higher H3K4me3 level at the 3′ end of the coding region on the episomes with very strong viral promoters. Different histone methyltransferases recruited to the viral and endogenous promoters may account for the overall lower level of H3K4me3 in the coding region downstream from the viral promoter.

References

    1. Allis, C. D., S. L. Berger, J. Cote, S. Dent., T. Jenuwien, T. Kouzarides, L. Pillus, D. Reinberg, Y. Shi, R. Shiekhattar, A. Shilatifard, J. Workman, and Y. Zhang. 2007. New nomenclature for chromatin-modifying enzymes. Cell 131:633-636. - PubMed
    1. Barski, A., S. Cuddapah, K. Cui, T. Y. Roh, D. E. Schones, Z. Wang, G. Wei, I. Chepelev, and K. Zhao. 2007. High-resolution profiling of histone methylations in the human genome. Cell 129:823-837. - PubMed
    1. Bernstein, B. E., M. Kamal, K. Lindblad-Toh, S. Bekiranov, D. K. Bailey, D. J. Huebert, S. McMahon, E. K. Karlsson, E. J. Kulbokas III, T. R. Gingeras, S. L. Schreiber, and E. S. Lander. 2005. Genomic maps and comparative analysis of histone modifications in human and mouse. Cell 120:169-181. - PubMed
    1. Daury, L., C. Chailleux, J. Bonvallet, and D. Trouche. 2006. Histone H3.3 deposition at E2F-regulated genes is linked to transcription. EMBO Rep. 7:66-71. - PMC - PubMed
    1. Han, L., I. G. Lin, and C. L. Hsieh. 2001. Protein binding protects sites on stable episomes and in the chromosome from de novo methylation. Mol. Cell. Biol. 21:3416-3424. - PMC - PubMed

LinkOut - more resources