. 2010 May 10;207(5):1095-111.
doi: 10.1084/jem.20092123. Epub 2010 Apr 19.

Antigen affinity discrimination is an intrinsic function of the B cell receptor

Affiliations

Antigen affinity discrimination is an intrinsic function of the B cell receptor

Wanli Liu et al. J Exp Med. .

Abstract

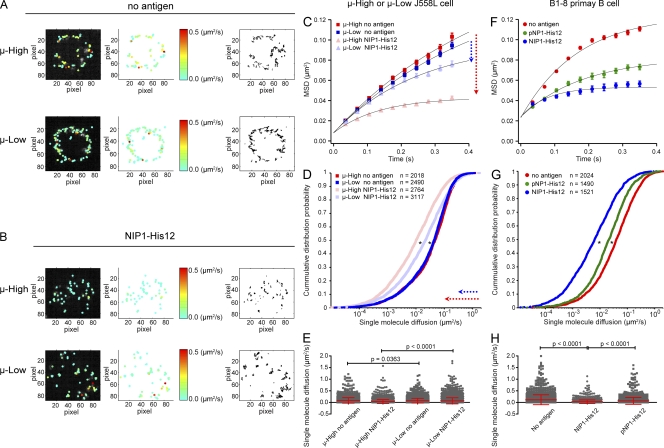
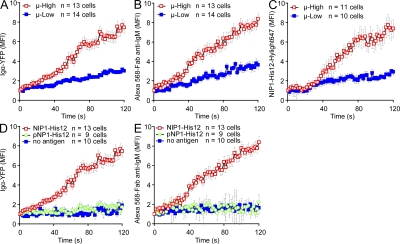
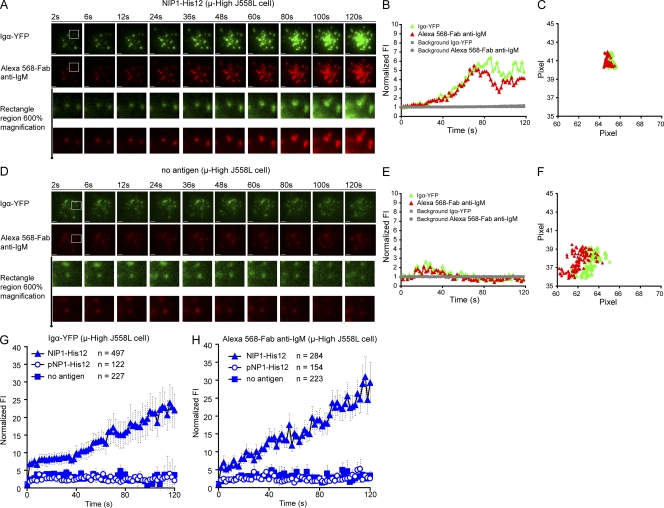
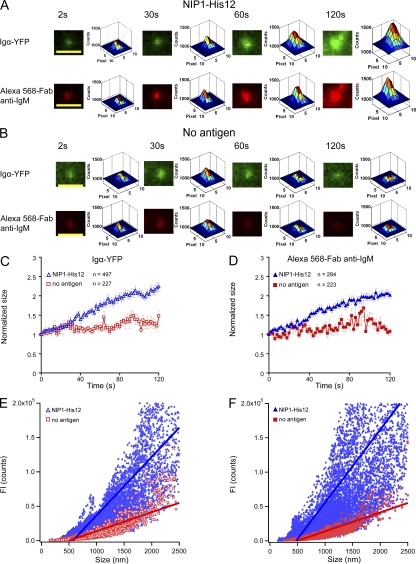
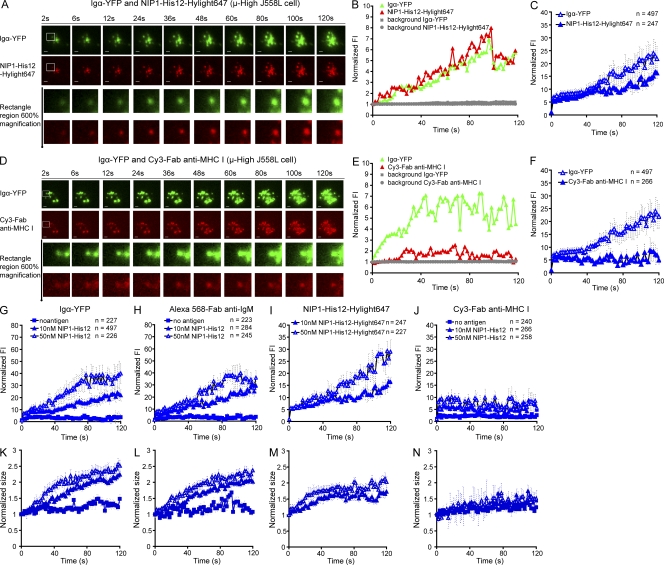
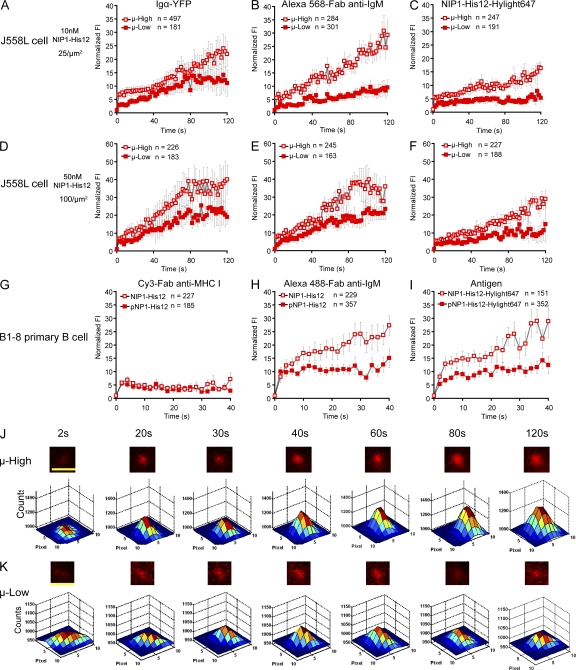
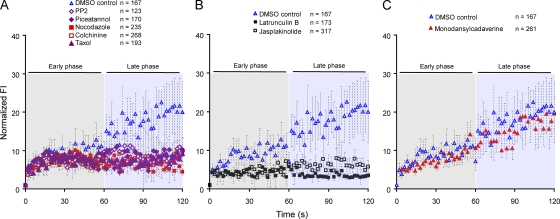
Antibody affinity maturation, a hallmark of adaptive immune responses, results from the selection of B cells expressing somatically hypermutated B cell receptors (BCRs) with increased affinity for antigens. Despite the central role of affinity maturation in antibody responses, the molecular mechanisms by which the increased affinity of a B cell for antigen is translated into a selective advantage for that B cell in immune responses is incompletely understood. We use high resolution live-cell imaging to provide evidence that the earliest BCR-intrinsic events that follow within seconds of BCR-antigen binding are highly sensitive to the affinity of the BCR for antigen. High affinity BCRs readily form oligomers and the resulting microclusters grow rapidly, resulting in enhanced recruitment of Syk kinase and calcium fluxes. Thus, B cells are able to read the affinity of antigen by BCR-intrinsic mechanisms during the earliest phases of BCR clustering, leading to the initiation of B cell responses.


Figures

Figure 1.
Figure 1.
High affinity BCRs show an enhanced ability to form immobile oligomers. (A and B) The μ-High and μ-Low J558L cells labeled with Alexa Fluor 568–Fab anti-IgM were placed on planar lipid bilayers lacking antigen (A) or containing NIP1-His12 (B), and single BCR molecule TIRF images were acquired. (left and middle) Individual BCR molecules in TIRF images from one typical μ-High or μ-Low J558L cell (Video 1) indicating the instant diffusion coefficient (D0) by pseudocolored spots. The display range of the pseudocolor is based on the D0 value of 0–0.5 µm2/s, a range that included most of the D0 values of the tracked BCRs (see E). (right) The accumulated trajectory footprints of individual BCR molecules in the entire time course. (C–H) The D0 values for all BCR molecules from μ-High and μ-Low J558L cells (C–E) or B1-8 primary B cells (F–H) labeled with Alexa Fluor 568–Fab anti-IgM placed on planar lipid bilayers containing no antigen, NIP1-His12, or pNP1-His12. All of the D0 values were displayed as MSD plots (C and F), CPD plots (D and G), or mean ± SD scattered plots (E and H). In C and D, the arrows indicate the change in the MSD (C) or single-molecule diffusion (D) for μ-High BCRs (red) and μ-Low BCRs (blue). Data represent single BCR molecules of the indicated numbers (D and G) for each condition from three independent experiments. The MSD plots (C and F) were further mathematically fitted into a confined diffusion model by an exponential function to acquire the size of the confinement microdomains, as detailed in Materials and methods. Significant differences by the Kolmogorov-Smirnov test are indicated (*, P < 0.0001) in D and G. One-tailed t tests were performed for statistical comparisons in E and H.
Figure 2.
Figure 2.
Accumulation of BCRs and antigen into the contact area between B cells and antigen-containing planar lipid bilayers is affinity dependent. (A–C) The mean FI (MFI) within the contact area of Igα-YFP (A), Alexa Fluor 568–Fab anti-IgM (B), or NIP1-His12-Hylight647 (C) is given over a 120-s time course (Videos 2–4) for μ-High and μ-Low J558L cells placed on planar lipid bilayers containing NIP1-His12 (A and B) or NIP1-His12-Hylight647 (C). (D and E) MFI of either Igα-YFP (D) or Alexa Fluor 568–Fab anti-IgM (E) is given over a 120-s time course for μ-High J558L cells placed on planar lipid bilayers containing no antigen, NIP1-His12, or pNP1-His12. The data represent means ± SEM of 9–14 B cells from three independent experiments.
Figure 3.
Figure 3.
BCR microclusters grow in FI with time when encountering antigen-containing lipid bilayers. (A–F) Shown are two-color time-lapse TIRF images of μ-High J558L cells labeled with Alexa Fluor 568–Fab anti-IgM placed on planar lipid bilayers containing antigen NIP1-His12 (A–C) or lacking antigen (D–F) over a time course of 120 s (Video 5). The BCR microclusters were examined by simultaneously imaging Igα-YFP (green) and Alexa Fluor 568–Fab anti-IgM (red), as described in Materials and methods. Bars, 1.5 µm. Typical microclusters in the images indicated by the white boxes are shown at 600% magnification for better resolution. The FIs of these microclusters were fitted by a 2D Gaussian function for precise 2D (x, y) coordinates and integral FI profiles, as detailed in Materials and methods. The normalized FI (B and E) and 2D trajectories by means of x versus y footprints (C and F) accumulated over the 120-s time course of these two typical microclusters are given. The gray horizontal lines in B and E show the background FI values for these two typical microclusters over time. The background FI value is the Z0 value acquired in the 2D Gaussian function upon mathematical fitting, as shown in Fig. S4 A. The normalized FIs of all BCR microclusters analyzed by Igα-YFP (G) or Alexa Fluor 568–Fab anti-IgM (H) in μ-High J558L cells placed on lipid bilayers containing no antigen, NIP1-His12, or pNP1-His12 represent means ± SEM from 9–13 μ-High J558L cells in three independent experiments. For Igα-YFP clusters, data from six experiments were pooled.
Figure 4.
Figure 4.
BCR microclusters grow in both size and FI with time when encountering antigen-containing lipid bilayers. (A and B) Pseudocolor 2.5D Gaussian images of one typical Igα-YFP or Alexa Fluor 568–Fab anti-IgM microcluster are shown at the indicated times (Video 5) for μ-High J558L cells placed on planar lipid bilayers containing NIP1-His12 (A) or lacking antigen (B). The FWHM of each BCR microcluster upon 2D Gaussian fitting was used as a measure of the size of the microclusters, as detailed in Materials and methods and Fig. S4 A. Bars, 1.5 µm. (C and D) Means ± SEM of the normalized size of BCR microclusters analyzed by Igα-YFP (C) or Alexa Fluor 568–Fab anti-IgM (D) are given at the indicated time points for μ-High J558L cells placed on planar lipid bilayers containing NIP1-His12 or lacking antigen. Data represent the indicated numbers of BCR microclusters examined in three independent experiments. (E and F) Linear regression analyses of the FI and the size of BCRs. The slopes of the linear fitting for μ-High J558L cells placed on planar lipid bilayers containing NIP1-His12 antigen were 85 (Igα-YFP; E) and 106 (Alexa Fluor 568–Fab anti-IgM; F). The slopes for μ-High J558L cells placed on planar lipid bilayers containing no antigen were each 27 (E and F).
Figure 5.
Figure 5.
The growth of BCR microclusters is selective and antigen concentration dependent. (A–F) Two-color time-lapse TIRF images of Igα-YFP (green) and NIP1-His12-Hylight647 (red) are given at the indicated time points (Video 6) for μ-High J558L cells placed on planar lipid bilayers containing NIP1-His12-Hylight647 (A). Similarly, two-color time-lapse TIRF images of Igα-YFP (green) and Cy3–Fab anti–MHC I (red) are given at the indicated time points (Video 7) for μ-High J558L cells placed on planar lipid bilayers containing NIP1-His12 (D). Bars, 1.5 µm. (A and D, bottom) Typical microclusters magnified 600% and analyzed by 2D Gaussian fitting. Shown are the normalized FI for Igα-YFP and NIP1-His12-Hylight647 (B) and Igα-YFP and Cy3–Fab anti–MHC I (E). The gray horizontal lines in B and E show the background FI values for these two typical microclusters over time. The background FI value is the Z0 value acquired in the 2D Gaussian function upon mathematical fitting, as shown in Fig. S4 A. Normalized FI of all Igα-YFP and NIP1-His12-Hylight647 clusters (C) or Igα-YFP and Cy3–Fab anti–MHC I clusters (F) are given with time. (G–N) The normalized FI (G–J) and size (K–N) of microclusters examined by Igα-YFP (G and K), Alexa Fluor 568–Fab anti-IgM (H and L), NIP1-His12-Hylight647 (I and M), or Cy3–Fab anti–MHC I (J and N) are given for μ-High J558L cells placed on lipid bilayers lacking antigen or containing NIP1-His12 antigen at a concentration of 10 nM (25 molecules/µm2) or 50 nM (100 molecules/µm2). The data represent means ± SEM of the indicated numbers of clusters in three independent experiments.
Figure 6.
Figure 6.
The growth in FI of BCR microclusters is antigen affinity dependent. (A–F) The normalized FI of BCR microclusters examined by Igα-YFP (A and D) and Alexa Fluor 568–Fab anti-IgM (B and E) or of antigen microclusters examined by NIP1-His12-Hylight647 (C and F) are given with time (Video 8) for μ-High or μ-Low J558L cells placed on planar lipid bilayers containing NIP1-His12 (A, B, D, and E) or NIP1-His12-Hylight647 (C and F) at a concentration of 10 nM (25 molecules/µm2) or 50 nM (100 molecules/µm2), as indicated. (G–I) The normalized FIs of Cy3–Fab anti–MHC I (G), IgM–Alexa Fluor 488 (H), and NIP1-His12-Hyligh647 (or pNP1-His12-Hyligh647; I) microclusters are given for B1-8 primary B cells placed on planar lipid bilayers containing the high affinity antigen NIP1-His12 or the low affinity antigen pNP1-His12. In A–I, the data represent means ± SEM of indicated numbers of microclusters in three independent experiments. (J and K) Also given are pseudocolor 2.5D Gaussian images of typical antigen microclusters examined by NIP1-His12-Hylight647 at the indicated times for μ-High (J) or μ-Low (K) J558L cells placed on antigen-containing lipid bilayers. The FWHM of each microcluster upon 2D Gaussian fitting was used as a measure of the size of the microclusters, as detailed in Materials and methods and Fig. S4 A. Bars, 1.5 µm.
Figure 7.
Figure 7.
BCR oligomerization–induced conformational changes in the BCR’s cytoplasmic domain are affinity dependent. FRET efficiencies between FRET donor Igα-YFP and FRET acceptor μ-CFP are given at the indicated time points for μ-High or μ-Low J558L cells placed on lipid bilayers containing NIP1-His12. (A) Means ± SD of FRET efficiencies are given over a time course of 240 s. (B and D) Statistical comparisons for the maximal changes in FRET (ΔFRET) from 0 and 200 s (B) and the time needed to reach maximal FRET efficiency (D) are given for μ-High and μ-Low J558L cells. (C) The half-life of FRET loss (τ50) of FRET efficiencies from maximal FRET levels in both μ-High and μ-Low J558L cells were acquired by fitting the FRET loss plot of individual cells into a monoexponential decay function, as detailed in Materials and methods. The bars represent means ± SD from 14 μ-High and μ-Low J558L cells in three independent experiments. Two-tailed t tests were performed for the statistical comparisons in B–D.
Figure 8.
Figure 8.
The affinity-dependent growth of BCR microclusters correlates with the strength of signaling. (A and B) μ-High and μ-Low J558L cells were fixed 10 min after placing them on lipid bilayers containing NIP1-His12 antigen. (C and D) B1-8 primary B cells were fixed 10 min after placing on lipid bilayers containing high affinity antigen NIP1-His12 or low affinity antigen pNP1-His12. The fixed B cells were probed for the recruitment of pSyk into the contact area of the B cells with the lipid bilayer by intracellular staining for pSyk. Shown are two-color TIRF images for BCR and pSyk (A and C). Bars, 1.5 µm. (B and D) The number of pSyk clusters accumulated in the contact area (top), the size of the contact area (middle), and mean BCR FI of the contact area (bottom). Each dot represents one cell analyzed in three independent experiments, and bars represent means ± SD. Two-tailed t tests were performed for the statistical comparisons in B and D. DIC, differential interference contrast.
Figure 9.
Figure 9.
The cellular requirements for the growth of BCR microclusters. (A–C) The μ-High J558L cells were treated with DMSO or the inhibitors shown (as detailed in Materials and methods), labeled with Alexa Fluor 568–Fab anti-IgM, and placed on lipid bilayers containing 10 nM NIP1-His12. TIRF images of Alexa Fluor 568 were obtained. The normalized FIs of Alexa Fluor 568–Fab anti-IgM BCR microclusters with time are shown, grouped according to the effect of the inhibitors on the growth of BCR microclusters during the early phase of the response (0–60 s; gray-shaded area) and the late phase (60–120 s; blue-shaded area). The data represent means ± SEM of the indicated numbers of BCR microclusters in three independent experiments.

Comment in

  • Affinity measured by microcluster.
    Fooksman DR, Dustin ML. Fooksman DR, et al. J Exp Med. 2010 May 10;207(5):907-9. doi: 10.1084/jem.20100780. Epub 2010 May 3. J Exp Med. 2010. PMID: 20439542 Free PMC article.

Similar articles

Cited by

References

    1. Adachi T., Wienands J., Wakabayashi C., Yakura H., Reth M., Tsubata T. 2001. SHP-1 requires inhibitory co-receptors to down-modulate B cell antigen receptor-mediated phosphorylation of cellular substrates. J. Biol. Chem. 276:26648–26655 10.1074/jbc.M100997200 - DOI - PubMed
    1. Allen D., Simon T., Sablitzky F., Rajewsky K., Cumano A. 1988. Antibody engineering for the analysis of affinity maturation of an anti-hapten response. EMBO J. 7:1995–2001 - PMC - PubMed
    1. Baldwin T., Sakthianandeswaren A., Curtis J.M., Kumar B., Smyth G.K., Foote S.J., Handman E. 2007. Wound healing response is a major contributor to the severity of cutaneous leishmaniasis in the ear model of infection. Parasite Immunol. 29:501–513 10.1111/j.1365-3024.2007.00969.x - DOI - PubMed
    1. Batista F.D., Harwood N.E. 2009. The who, how and where of antigen presentation to B cells. Nat. Rev. Immunol. 9:15–27 10.1038/nri2454 - DOI - PubMed
    1. Berek C., Griffiths G.M., Milstein C. 1985. Molecular events during maturation of the immune response to oxazolone. Nature. 316:412–418 10.1038/316412a0 - DOI - PubMed

Publication types

MeSH terms