. 2010 May 10;207(5):1113-24.
doi: 10.1084/jem.20092210. Epub 2010 Apr 19.

S1P1 receptor directs the release of immature B cells from bone marrow into blood

Affiliations

S1P1 receptor directs the release of immature B cells from bone marrow into blood

Maria L Allende et al. J Exp Med. .

Abstract

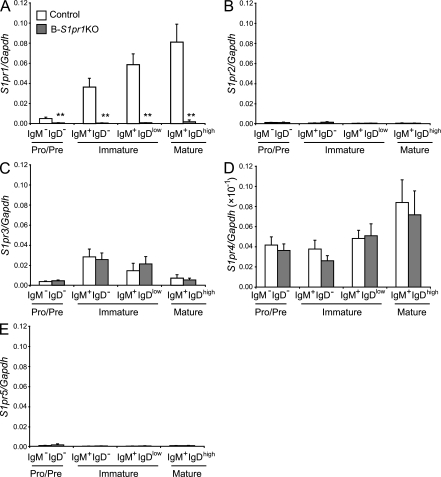
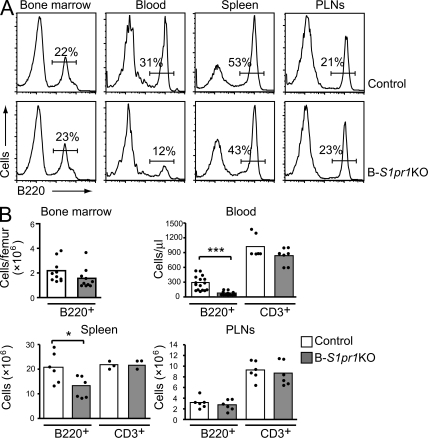
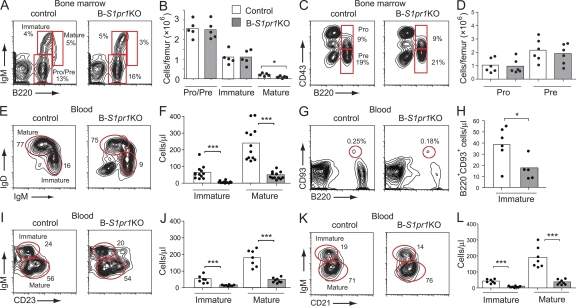
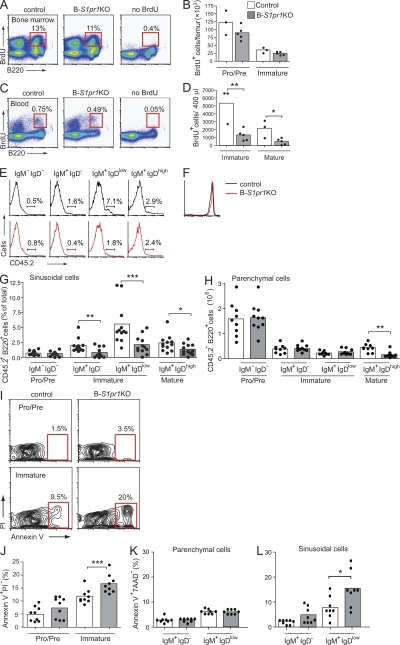
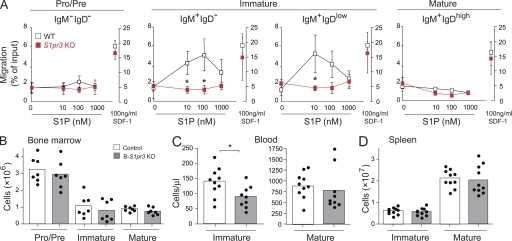
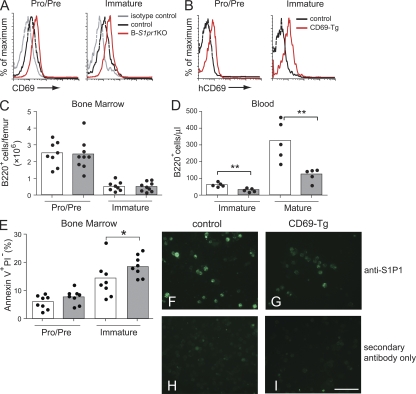
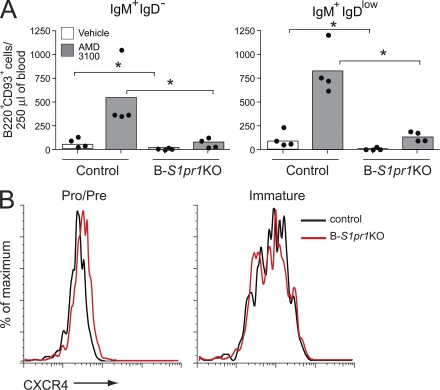
S1P1 receptor expression is required for the egress of newly formed T cells from the thymus and exit of mature T and B cells from secondary lymphoid organs. In this study, we deleted the expression of the S1P1 receptor gene (S1pr1) in developing B cells in the bone marrow. Although B cell maturation within the bone marrow was largely normal in the B cell-specific S1pr1 knockout (B-S1pr1KO) mice, their newly generated immature B cells appeared in the blood at abnormally low numbers as compared with control mice. In the bone marrow of B-S1pr1KO mice, immature B cells in contact with the vascular compartment displayed increased apoptosis as compared with control mice. Forced expression of CD69, a negative regulator of S1P1 receptor expression, in developing bone marrow B cells also reduced the number of immature B cells in the blood. Attenuation of CXCR4 signaling, which is required for the proper retention of developing B cells in bone marrow, did not release immature B cells into the blood of B-S1pr1KO mice as effectively as in control mice. Our results indicate that the S1P1 receptor provides a signal necessary for the efficient transfer of newly generated immature B cells from the bone marrow to the blood.


Figures

Figure 1.
Figure 1.
Expression of S1P receptors in bone marrow B cell subpopulations. (A–E) mRNA expression for S1pr1 (A), S1pr2 (B), S1pr3 (C), S1pr4 (D), and S1pr5 (E) in sorted B cell subpopulations from control and B-S1pr1KO bone marrow was determined by real-time PCR. Bars represent mean values ± SD from three experiments (n = 3 mice per genotype). **, P < 0.01 (Student's t test).
Figure 2.
Figure 2.
Reduced numbers of B cells in the blood and spleens of B-S1pr1KO mice. (A and B) Flow cytometry analysis of B220+ B cells and CD3+ T cells in peripheral tissues from 8–12-wk-old B-S1pr1KO and control mice. Lymphocytes from the bone marrow, peripheral blood, spleens, and PLNs from control and B-S1pr1KO mice were analyzed by flow cytometry using FITC-conjugated anti-B220 and PE-conjugated anti-CD3 antibodies. Results are shown as histograms (A) and the absolute number of cells counted (B) in each organ or per microliter of peripheral blood. In B, bars represent mean values of pooled data, and the closed circles are individual mice. Data are pooled from two to four experiments. *, P < 0.05; ***, P < 0.005 (Student's t test).
Figure 3.
Figure 3.
Reduced numbers of mature and immature B cells in the blood of B-S1pr1KO mice. (A–D) Bone marrow B cell subpopulations from control and B-S1pr1KO mice were analyzed by flow cytometry using FITC-conjugated anti-B220, APC-conjugated anti-IgM, and PE-conjugated anti-CD43 antibodies. Pro–/pre–B cells were identified as B220low IgM, immature B cells were identified as B220low IgM+, and mature B cells were identified as B220high IgM+. Pro–B cells were identified as B220low IgM CD43+ and pre–B cells were identified as B220low IgM CD43. Results are shown as density plots (A and C) and as the absolute number of cells counted per femur (B and D). The percentage of cells in each gate is indicated on the plots. Bars represent mean values of pooled data from two experiments, and the closed circles are individual mice. *, P < 0.05 (Mann-Whitney test). (E–L) B cells from the peripheral blood of control and B-S1pr1KO mice were analyzed by flow cytometry. Immature B cells were identified as B220+ IgDlow IgMhigh (E and F), B220+ CD93+ (G and H), B220+ CD23low IgMhigh (I and J), and B220+ CD21low IgMhigh (K and L). Mature B cells were identified as B220+ IgDhigh IgMlow (E and F), B220+ CD23high IgMlow (I and J), and B220+ CD21high IgMlow (K and L). Results are expressed as a density plot (E, G, I, and K) and the absolute number of cells counted per microliter of peripheral blood (F, H, J, and L). *, P < 0.05; ***, P < 0.005 (Mann-Whitney test). Data in F, H, J, and L are mean values representative of three independent experiments.
Figure 4.
Figure 4.
Immature B cells in the bone marrow do not efficiently enter blood and have elevated apoptosis in the absence of S1P1 receptor. (A–D) Mice were pulsed with BrdU, and B cells from the bone marrow (A and B) and peripheral blood (C and D) of control and B-S1pr1KO mice were analyzed by flow cytometry using anti-B220, anti-IgD, and anti-IgM antibodies in combination with BrdU detection methodology, as described in Materials and methods. Results are shown as dot plots (A and C), and as absolute numbers of BrdU+ B220low IgM (pro–/pre–) and B220low IgM+ (immature) B cells per femur (B) and BrdU+ B220+ IgDlow IgMhigh (immature) and B220+ IgDhigh IgMlow (mature) B cells per 400 µl of blood (D). The percentage of cells in each gate is indicated on the plots. Bars represent mean values, and the closed circles are individual mice. Data are representative of three experiments with three to five mice of each genotype per experiment. *, P < 0.05; **, P = 0.01 (Student's t test). (E and G) In vivo staining of bone marrow sinusoidal B cells. Mice were injected intravenously with PE-conjugated anti-CD45.2 antibody. After 2 min, the bone marrow cells and peripheral blood were obtained and stained with PerCP-conjugated anti-B220, APC-conjugated anti-IgM, and FITC-conjugated anti-IgD antibodies. Results are shown as histograms (E) and as the percentage of CD45.2-PE+ (sinusoidal cells; G) for pro–/pre– (B220+ IgD IgM), immature (B220+ IgM+ IgD and B220+ IgM+ IgDlow), and mature (B220+ IgM+ IgDhigh) bone marrow B cells from control and B-S1pr1KO mice. On the histograms (E), the bars show the percentage of PE-CD45.2+ cells for each group. (F) Lymphocytes stained in the peripheral blood by injection of PE-conjugated anti-CD45.2 antibody, showing equal staining in control and B-S1pr1KO mice. (H) Cells that were negative for anti-CD45.2–PE antibody staining were considered as parenchymal cells. Results are shown as mean values of four independent experiments (n = 10–12 mice per genotype). *, P < 0.05; **, P < 0.01; ***, P < 0.005 (Mann-Whitney test). (I and J) Annexin V staining was determined on B cells from the bone marrow of control and B-S1pr1KO mice. Results are shown as density plots (I) and as the percentage (J) of annexin V+ PI B220low IgM (pro–/pre–) and B220low IgM+ (immature) B cells per femur. Pooled data are from five experiments (n = 9 for each genotype). ***, P < 0.005 (Mann-Whitney test). (K and L) Annexin V staining on sinusoidal and parenchymal immature B cells. Cells were labeled in vivo with PE-conjugated anti-CD45.2 antibody and gated as in E and H. Annexin V staining was determined on immature bone marrow B cells (B220+ 7-AAD IgM+ IgD and B220+ 7-AAD IgM+ IgDlow) partitioned into parenchymal cells (CD45.2; K) and sinusoidal cells (CD45.2+; L) from control and B-S1pr1KO mice. Pooled data are from three experiments (n = 8 for each genotype). *, P < 0.05 (Mann-Whitney test).
Figure 5.
Figure 5.
Migration of bone marrow B cells toward S1P is mediated by the S1P3 receptor. (A) Total bone marrow cells were added to a Transwell insert and allowed to respond to increasing concentrations of S1P or to 100 ng/ml SDF-1 in the lower well. Percentages of the input that were found in the lower well after a 3-h incubation with S1P (left axis) or with SDF-1 (right axis) were plotted for pro–/pre– (B220+ IgD IgM), immature (B220+ IgM+ IgD and B220+ IgM+ IgDlow), and mature (B220+ IgM+ IgDhigh) B cells. Data are presented as mean values ± SD (n = 3 for each genotype) and are representative of three independent experiments. *, P < 0.05. (B–D) Distribution of B cells in S1pr3 KO mice. B cell subpopulations from the bone marrow (n = 7 per genotype; B), blood (n = 10; C), and spleen (n = 10; D) from WT and S1pr3 KO mice were analyzed by flow cytometry using PE-Cy7–conjugated anti-B220, APC-conjugated anti-IgM, and FITC-conjugated anti-IgD antibodies. Results are pooled data from three independent experiments. *, P < 0.05.
Figure 6.
Figure 6.
CD69 expression in bone marrow B cells modulates the appearance of immature B cells in peripheral blood. (A) CD69 expression on bone marrow B cells. Results are shown as anti-CD69 fluorescence intensity for cells from control and B-S1pr1KO mice compared with the isotype control. Representative results are from nine independent experiments. (B) Expression of the human CD69 transgene on bone marrow total B cells in control and transgenic (CD69-Tg) mice. B220+ bone marrow cells were analyzed for their expression of human CD69 by flow cytometry. (C and D) Distribution of B220low IgM (pro–/pre–) and B220low IgM+ (immature) B cells in the bone marrow (C) and of B220+ IgDlow IgM+ (immature) and B220+ IgDhigh IgMlow (mature) B cells in the peripheral blood (D) of control and CD69 transgenic mice. Bars represent mean values, and the closed circles are individual mice. Data represent pooled results from three experiments. **, P < 0.01 (Mann-Whitney test). (E) Annexin V staining on B cells from the bone marrow of control and CD69 transgenic mice. Results are shown as the percentage of annexin V+ PI B220low IgM (pro–/pre–) and annexin V+ PI B220low IgM+ (immature) B cells per femur and represent pooled data from four independent experiments (n = 8). *, P < 0.05 (Mann-Whitney test). (F–I) Expression of S1P1 receptor on IgM+ bone marrow B cells of control and transgenic CD69 mice. IgM+ cells were magnetically sorted from total bone marrow cells, fixed, permeabilized, and stained in suspension using a rabbit anti-S1P1 receptor antibody. After incubation with Alexa Fluor 488–conjugated anti–rabbit IgG, the cells were attached to a slide using a cytocentrifuge and visualized by fluorescence microscopy. Bar, 50 µm.
Figure 7.
Figure 7.
Impaired release of immature bone marrow B cells by CXCR4 antagonism in the absence of S1P1 receptor. (A) Mice were injected with the CXCR4 antagonist AMD3100 or vehicle alone, and bone marrow and blood were collected after 90 min. Immature bone marrow B cells in the blood (B220+ CD93+) were gated as IgM+ IgD and IgM+ IgDlow, and quantified from control and B-S1pr1KO mice. Results are shown as absolute numbers in 250 µl of blood. Bars represent mean values, and the closed circles are individual mice. Data are representative of three experiments. *, P < 0.05 (Mann-Whitney test). (B) CXCR4 expression on pro–/pre– (B220low IgM) and immature (B220low IgM+) bone marrow B cells.

References

    1. Allende M.L., Yamashita T., Proia R.L. 2003. G-protein-coupled receptor S1P1 acts within endothelial cells to regulate vascular maturation. Blood. 102:3665–3667 10.1182/blood-2003-02-0460 - DOI - PubMed
    1. Allende M.L., Dreier J.L., Mandala S., Proia R.L. 2004. Expression of the sphingosine 1-phosphate receptor, S1P1, on T-cells controls thymic emigration. J. Biol. Chem. 279:15396–15401 10.1074/jbc.M314291200 - DOI - PubMed
    1. Allende M.L., Zhou D., Kalkofen D.N., Benhamed S., Tuymetova G., Borowski C., Bendelac A., Proia R.L. 2008. S1P1 receptor expression regulates emergence of NKT cells in peripheral tissues. FASEB J. 22:307–315 10.1096/fj.07-9087com - DOI - PubMed
    1. Alvarez S.E., Milstien S., Spiegel S. 2007. Autocrine and paracrine roles of sphingosine-1-phosphate. Trends Endocrinol. Metab. 18:300–307 10.1016/j.tem.2007.07.005 - DOI - PubMed
    1. Brinkmann V., Davis M.D., Heise C.E., Albert R., Cottens S., Hof R., Bruns C., Prieschl E., Baumruker T., Hiestand P., et al. 2002. The immune modulator FTY720 targets sphingosine 1-phosphate receptors. J. Biol. Chem. 277:21453–21457 10.1074/jbc.C200176200 - DOI - PubMed

Publication types

Substances