Nonlinear coupling between cerebral blood flow, oxygen consumption, and ATP production in human visual cortex
- PMID: 20404151
- PMCID: PMC2889577
- DOI: 10.1073/pnas.0909711107
Nonlinear coupling between cerebral blood flow, oxygen consumption, and ATP production in human visual cortex
Abstract
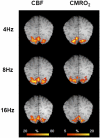
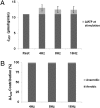
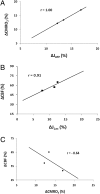
The purpose of this study was to investigate activation-induced hypermetabolism and hyperemia by using a multifrequency (4, 8, and 16 Hz) reversing-checkerboard visual stimulation paradigm. Specifically, we sought to (i) quantify the relative contributions of the oxidative and nonoxidative metabolic pathways in meeting the increased energy demands [i.e., ATP production (J(ATP))] of task-induced neuronal activation and (ii) determine whether task-induced cerebral blood flow (CBF) augmentation was driven by oxidative or nonoxidative metabolic pathways. Focal increases in CBF, cerebral metabolic rate of oxygen (CMRO(2); i.e., index of aerobic metabolism), and lactate production (J(Lac); i.e., index of anaerobic metabolism) were measured by using physiologically quantitative MRI and spectroscopy methods. Task-induced increases in J(ATP) were small (12.2-16.7%) at all stimulation frequencies and were generated by aerobic metabolism (approximately 98%), with %DeltaJ(ATP) being linearly correlated with the percentage change in CMRO(2) (r = 1.00, P < 0.001). In contrast, task-induced increases in CBF were large (51.7-65.1%) and negatively correlated with the percentage change in CMRO(2) (r = -0.64, P = 0.024), but positively correlated with %DeltaJ(Lac) (r = 0.91, P < 0.001). These results indicate that (i) the energy demand of task-induced brain activation is small (approximately 15%) relative to the hyperemic response (approximately 60%), (ii) this energy demand is met through oxidative metabolism, and (iii) the CBF response is mediated by factors other than oxygen demand.
Conflict of interest statement
The authors declare no conflict of interest.
Figures


References
-
- Frackowiak RS, Lenzi GL, Jones T, Heather JD. Quantitative measurement of regional cerebral blood flow and oxygen metabolism in man using 15O and positron emission tomography: theory, procedure, and normal values. J Comput Assist Tomogr. 1980;4:727–736. - PubMed
-
- Mintun MA, Raichle ME, Martin WR, Herscovitch P. Brain oxygen utilization measured with O-15 radiotracers and positron emission tomography. J Nucl Med. 1984;25:177–187. - PubMed
-
- Fox PT, Raichle ME, Mintun MA, Dence C. Nonoxidative glucose consumption during focal physiologic neural activity. Science. 1988;241:462–464. - PubMed
Publication types
MeSH terms
Substances
Grants and funding
LinkOut - more resources
Full Text Sources
Miscellaneous

