. 2010 May 4;107(18):8481-5.
doi: 10.1073/pnas.0912357107. Epub 2010 Apr 19.

Auditory discrimination learning and knowledge transfer in mice depends on task difficulty

Affiliations

Auditory discrimination learning and knowledge transfer in mice depends on task difficulty

Simone Kurt et al. Proc Natl Acad Sci U S A. .

Abstract

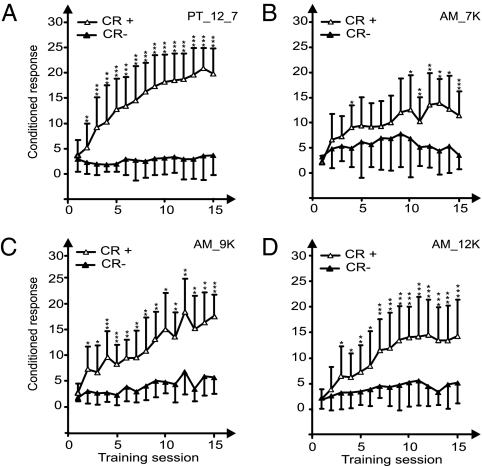
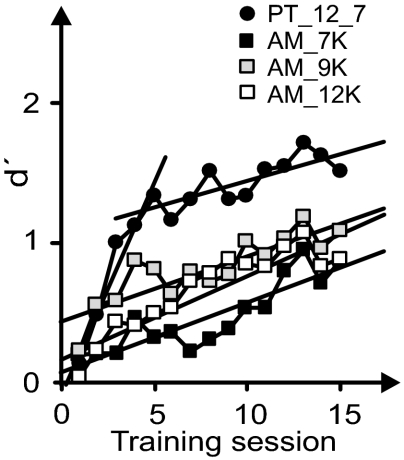
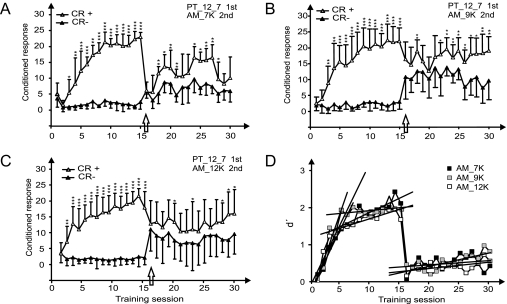
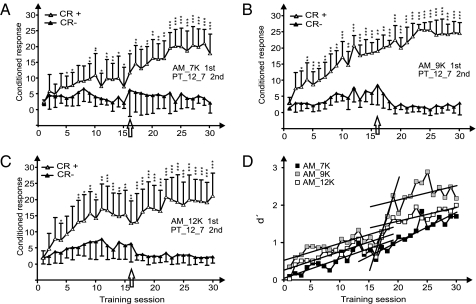
Mice reproduce interesting effects in auditory discrimination learning and knowledge transfer discussed in human studies: (i) the advantage in the transfer from a hard to an easy task by benefits from transfer of procedural knowledge and information-integration learning, and (ii) the disadvantage in the transfer from easy to hard tasks by inability to generalize across perceptually different classes of stimuli together with initially unsuccessful attempts to transfer cognitive skills from one task to the other. House mice (NMRI strain) were trained in a shuttle-box stimulus discrimination task. They had to discriminate either between two pure tones of different frequencies (PT) or between two different modulation frequencies of an amplitude-modulated tone (AM). Then transfer of knowledge between these two tasks was tested. Mice rapidly learned PT discrimination within two to three training sessions (easy task). AM discrimination learning took longer and did not reach the high performance level of PT discrimination (hard task). No knowledge transfer was detected in animals first trained with the easy (PT) followed by the hard (AM) discrimination task. Mice benefited, however, from knowledge transfer when the AM discrimination was followed by the PT discrimination. When the task changed, confusion of conditioned stimuli occurred if the carrier frequency of the AM was the same as one of the frequencies in the PT task. These results show a hard-to-easy effect when possible knowledge transfer is tested between qualitatively different stimulus classes. The data establish mice as promising animal model for research on genetics of auditory perception and learning.


Conflict of interest statement

The authors declare no conflict of interest.

Figures

Fig. 1.
Fig. 1.
Learning curves for the PT discrimination group A1 (A) and the three AM discrimination groups A2 (B), A3 (C), and A4 (D). (A) PT 12 kHz vs. 7 kHz. (BD) AM with modulation frequencies of 20 vs. 40 Hz and carrier frequency of 7 kHz (B), 9 kHz (C), or 12 kHz (D). Plotted is the number of hits (CR+) and false alarms (CR) as a function of number of training sessions. SDs deviations are shown only unilaterally for clarity. *, P < 0.05; **, P < 0.01; ***, P < 0.001 (Mann–Whitney U test).
Fig. 2.
Fig. 2.
The dynamics of learning are expressed by the development of average d′ values as a function of the training session. The d′ functions are approximated by linear regression lines. For the PT group (group A1, black circle), fast improvement in discrimination over the first five training sessions with slope b = 0.302 (r = 0.975, P < 0.01) was followed by a slower improvement with slope b = 0.038 (r = 0.775, P < 0.01) during later training sessions. For AM groups there was shallow improvement of discrimination over all training sessions with slope b = 0.050 (r = 0.878, P < 0.001) for AM 7 kHz (group A2, black square), b = 0.046 (r = 0.856, P < 0.01) for AM 9 kHz (group A3, gray square), and b = 0.059 (r = 0.913, P < 0.001) for AM 12 kHz (group A4, open square).
Fig. 3.
Fig. 3.
Learning transfer from an easy to a hard task. (AC) Learning curves for the groups B1–B3 which were trained for PT discrimination in the first training period (sessions 1–15) and then for AM discrimination with the carrier frequency (A) 7 kHz (group B1), (B) 9 kHz (group B2), or (C) 12 kHz (group B3) in the second training period starting with training session 16 (arrow). (For further information, see Fig. 1.) (D) The dynamics of learning are expressed by the development of average d′ values as a function of the training session. The d′ functions are approximated by linear regression lines with the following parameters. PT discrimination showed an initial fast increase [group B1 (7 kHz, black square): slope b = 0.298 (r = 0.977); group B2 (9 kHz, gray square): slope b = 0.462 (r = 0.945); group B3 (12 kHz, open square): slope b = 0.330 (r = 0.917)] followed by a later slow increase [group B1 (7 kHz, black square): slope b = 0.054 (r = 0.803); group B2 (9 kHz, gray square): slope b = 0.015 (r = 0.334); group B3 (12 kHz, open square): slope b = 0.043 (r = 0.762)]. The slow improvements during AM discrimination learning from training session 16 onwards are characterized by the slope b = 0.009 (r = 0.246) for group B1 (7 kHz), b = 0.035 (r = 0.752) for group B2 (9 kHz), and b = 0.017 (r = 0.565) for group B3 (12 kHz). *, P < 0.05; **, P < 0.01; ***, P < 0.001 (Mann–Whitney U test).
Fig. 4.
Fig. 4.
Learning transfer from a hard to an easy task. (AC) Learning curves for the groups C1–C3, which were trained for AM discrimination with the carrier frequency 7 kHz (group C1) (A), 9 kHz (group C2) (B), or 12 kHz (group C3) (C) in training sessions 1–15 and for PT discrimination (12 vs. 7 kHz) in the second training period starting with training session 16 (arrow). (For further information, see Fig. 1.) (D) The dynamics of learning are expressed by the development of average d′ values as a function of the training session. The parameters of the linear regression lines for training sessions 1–15 (AM training) are slope b = 0.054 (r = 0.887) for group C1 (7 kHz); slope b = 0.047 (r = 0.857) for group C2 (9 kHz); and slope b = 0.051 (r = 0.860) for group C3 (12 kHz). The parameters of the linear regression lines for training sessions 16–30 (PT training) are slope b = 0.078 (r = 0.907) for group C1 (previously trained in the AM 7-kHz task); an initial steep slope b = 0.443 (r = 0.995) and a later shallow slope b = 0.038 (r = 0.450) for group C2 (previously trained in the AM 9-kHz task); and slope b = 0.036 (r = 0.787) for group C3 (previously trained in the AM 12-kHz task). *, P < 0.05; **, P < 0.01; ***, P < 0.001. (Mann–Whitney U test)

Similar articles

Cited by

References

    1. Delhommeau K, Micheyl C, Jouvet R, Collet L. Transfer of learning across durations and ears in auditory frequency discrimination. Percept Psychophys. 2002;64:426–436. - PubMed
    1. Demany L, Semal C. Learning to perceive pitch differences. J Acoust Soc Am. 2002;111:1377–1388. - PubMed
    1. Grimault N, Micheyl C, Carlyon RP, Bacon SP, Collet L. Learning in discrimination of frequency or modulation rate: Generalization to fundamental frequency discrimination. Hear Res. 2003;184:41–50. - PubMed
    1. Karmarkar UR, Buonomano DV. Temporal specificity of perceptual learning in an auditory discrimination task. Learn Mem. 2003;10:141–147. - PMC - PubMed
    1. Liu EH, Mercado E, III, Church BA, Orduña I. The easy-to-hard effect in human (Homo sapiens) and rat (Rattus norvegicus) auditory identification. J Comp Psychol. 2008;122:132–145. - PMC - PubMed

LinkOut - more resources