

Diversification in the genetic architecture of gene expression and transcriptional networks in organ differentiation of Populus
- PMID: 20404162
- PMCID: PMC2889559
- DOI: 10.1073/pnas.0914709107
Diversification in the genetic architecture of gene expression and transcriptional networks in organ differentiation of Populus
Abstract
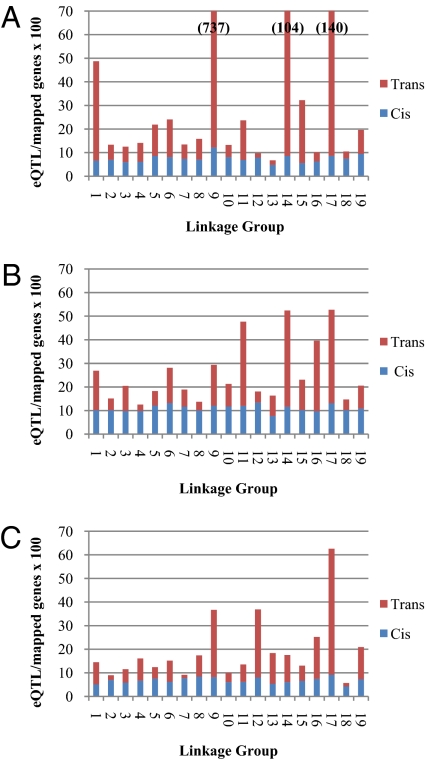
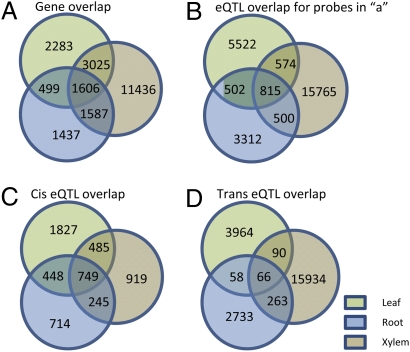
A fundamental goal of systems biology is to identify genetic elements that contribute to complex phenotypes and to understand how they interact in networks predictive of system response to genetic variation. Few studies in plants have developed such networks, and none have examined their conservation among functionally specialized organs. Here we used genetical genomics in an interspecific hybrid population of the model hardwood plant Populus to uncover transcriptional networks in xylem, leaves, and roots. Pleiotropic eQTL hotspots were detected and used to construct coexpression networks a posteriori, for which regulators were predicted based on cis-acting expression regulation. Networks were shown to be enriched for groups of genes that function in biologically coherent processes and for cis-acting promoter motifs with known roles in regulating common groups of genes. When contrasted among xylem, leaves, and roots, transcriptional networks were frequently conserved in composition, but almost invariably regulated by different loci. Similarly, the genetic architecture of gene expression regulation is highly diversified among plant organs, with less than one-third of genes with eQTL detected in two organs being regulated by the same locus. However, colocalization in eQTL position increases to 50% when they are detected in all three organs, suggesting conservation in the genetic regulation is a function of ubiquitous expression. Genes conserved in their genetic regulation among all organs are primarily cis regulated (approximately 92%), whereas genes with eQTL in only one organ are largely trans regulated. Trans-acting regulation may therefore be the primary driver of differentiation in function between plant organs.
Conflict of interest statement
The authors declare no conflict of interest.
Figures
Similar articles
-
Genome-wide association studies and expression-based quantitative trait loci analyses reveal roles of HCT2 in caffeoylquinic acid biosynthesis and its regulation by defense-responsive transcription factors in Populus.New Phytol. 2018 Oct;220(2):502-516. doi: 10.1111/nph.15297. Epub 2018 Jul 11. New Phytol. 2018. PMID: 29992670
-
A systems biology model of the regulatory network in Populus leaves reveals interacting regulators and conserved regulation.BMC Plant Biol. 2011 Jan 13;11:13. doi: 10.1186/1471-2229-11-13. BMC Plant Biol. 2011. PMID: 21232107 Free PMC article.
-
Systems genetic analysis of lignin biosynthesis in Populus tremula.New Phytol. 2024 Sep;243(6):2157-2174. doi: 10.1111/nph.19993. Epub 2024 Jul 28. New Phytol. 2024. PMID: 39072753
-
Expression quantitative trait loci mapping identified PtrXB38 as a key hub gene in adventitious root development in Populus.New Phytol. 2023 Sep;239(6):2248-2264. doi: 10.1111/nph.19126. Epub 2023 Jul 24. New Phytol. 2023. PMID: 37488708
-
Providing biological context for GWAS results using eQTL regulatory and co-expression networks in Populus.New Phytol. 2024 Oct;244(2):603-617. doi: 10.1111/nph.20026. Epub 2024 Aug 21. New Phytol. 2024. PMID: 39169686
Cited by
-
Differential gene expression and associated QTL mapping for cotton yield based on a cDNA-AFLP transcriptome map in an immortalized F2.Theor Appl Genet. 2011 Aug;123(3):439-54. doi: 10.1007/s00122-011-1597-5. Epub 2011 Apr 22. Theor Appl Genet. 2011. PMID: 21512772
-
Organ specificity and transcriptional control of metabolic routes revealed by expression QTL profiling of source--sink tissues in a segregating potato population.BMC Plant Biol. 2012 Feb 7;12:17. doi: 10.1186/1471-2229-12-17. BMC Plant Biol. 2012. PMID: 22313736 Free PMC article.
-
Genetic dissection of growth, wood basic density and gene expression in interspecific backcrosses of Eucalyptus grandis and E. urophylla.BMC Genet. 2012 Jul 20;13:60. doi: 10.1186/1471-2156-13-60. BMC Genet. 2012. PMID: 22817272 Free PMC article.
-
Xylan in the Middle: Understanding Xylan Biosynthesis and Its Metabolic Dependencies Toward Improving Wood Fiber for Industrial Processing.Front Plant Sci. 2019 Feb 25;10:176. doi: 10.3389/fpls.2019.00176. eCollection 2019. Front Plant Sci. 2019. PMID: 30858858 Free PMC article. Review.
-
High-level expression of sugar inducible gene2 (HSI2) is a negative regulator of drought stress tolerance in Arabidopsis.BMC Plant Biol. 2013 Oct 29;13:170. doi: 10.1186/1471-2229-13-170. BMC Plant Biol. 2013. PMID: 24168327 Free PMC article.
References
-
- King MC, Wilson AC. Evolution at 2 levels in humans and chimpanzees. Science. 1975;188:107–116. - PubMed
-
- Jansen RC, Nap JP. Genetical genomics: The added value from segregation. Trends Genet. 2001;17:388–391. - PubMed
-
- Schadt EE, et al. Genetics of gene expression surveyed in maize, mouse and man. Nature. 2003;422:297–302. - PubMed
Publication types
MeSH terms
Associated data
- Actions
- Actions
- Actions
LinkOut - more resources
Full Text Sources
Other Literature Sources
Molecular Biology Databases
