

Perifornical Urocortin-3 mediates the link between stress-induced anxiety and energy homeostasis
- PMID: 20404164
- PMCID: PMC2889556
- DOI: 10.1073/pnas.1003969107
Perifornical Urocortin-3 mediates the link between stress-induced anxiety and energy homeostasis
Abstract
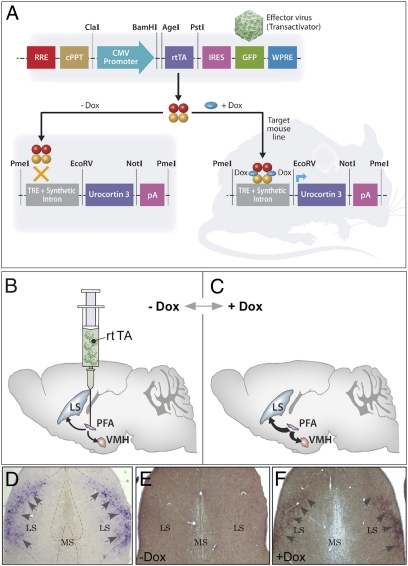
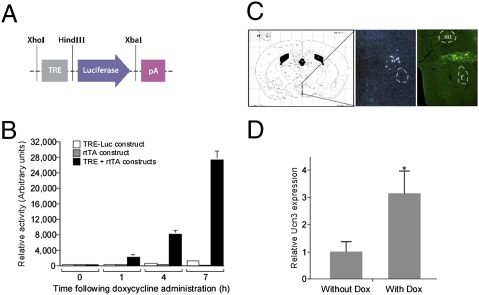
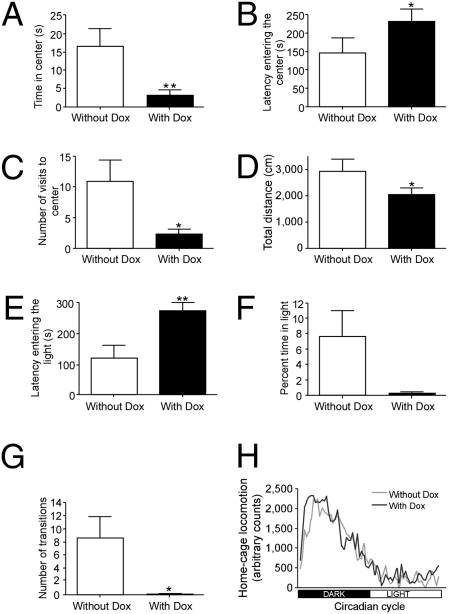
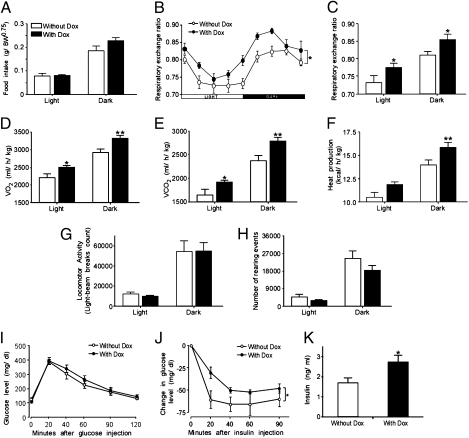
In response to physiological or psychological challenges, the brain activates behavioral and neuroendocrine systems linked to both metabolic and emotional outputs designed to adapt to the demand. However, dysregulation of integration of these physiological responses to challenge can have severe psychological and physiological consequences, and inappropriate regulation, disproportional intensity, or chronic or irreversible activation of the stress response is linked to the etiology and pathophysiology of mood and metabolic disorders. Using a transgenic mouse model and lentiviral approach, we demonstrate the involvement of the hypothalamic neuropeptide Urocortin-3, a specific ligand for the type-2 corticotropin-releasing factor receptor, in modulating septal and hypothalamic nuclei responsible for anxiety-like behaviors and metabolic functions, respectively. These results position Urocortin-3 as a neuromodulator linking stress-induced anxiety and energy homeostasis and pave the way toward better understanding of the mechanisms that mediate the reciprocal relationships between stress, mood and metabolic disorders.
Conflict of interest statement
The authors declare no conflict of interest.
Figures
Similar articles
-
Chronic activation of corticotropin-releasing factor type 2 receptors reveals a key role for 5-HT1A receptor responsiveness in mediating behavioral and serotonergic responses to stressful challenge.Biol Psychiatry. 2012 Sep 15;72(6):437-47. doi: 10.1016/j.biopsych.2012.05.005. Epub 2012 Jun 15. Biol Psychiatry. 2012. PMID: 22704666 Free PMC article.
-
Urocortins: emerging metabolic and energy homeostasis perspectives.Trends Endocrinol Metab. 2008 May-Jun;19(4):122-9. doi: 10.1016/j.tem.2007.12.002. Epub 2008 Mar 11. Trends Endocrinol Metab. 2008. PMID: 18337115 Review.
-
Site-specific genetic manipulation of amygdala corticotropin-releasing factor reveals its imperative role in mediating behavioral response to challenge.Biol Psychiatry. 2012 Feb 15;71(4):317-26. doi: 10.1016/j.biopsych.2011.05.036. Epub 2011 Jul 23. Biol Psychiatry. 2012. PMID: 21783178
-
Mice deficient for both corticotropin-releasing factor receptor 1 (CRFR1) and CRFR2 have an impaired stress response and display sexually dichotomous anxiety-like behavior.J Neurosci. 2002 Jan 1;22(1):193-9. doi: 10.1523/JNEUROSCI.22-01-00193.2002. J Neurosci. 2002. PMID: 11756502 Free PMC article.
-
A role for corticotropin releasing factor and urocortin in behavioral responses to stressors.Brain Res. 1999 Nov 27;848(1-2):141-52. doi: 10.1016/s0006-8993(99)01991-5. Brain Res. 1999. PMID: 10612706 Review.
Cited by
-
Corticotropin-releasing factor-related peptides, serotonergic systems, and emotional behavior.Front Neurosci. 2013 Sep 20;7:169. doi: 10.3389/fnins.2013.00169. Front Neurosci. 2013. PMID: 24065880 Free PMC article. Review.
-
Type 2 corticotropin-releasing factor receptor in the ventromedial nucleus of hypothalamus is critical in regulating feeding and lipid metabolism in white adipose tissue.Endocrinology. 2012 Jan;153(1):166-76. doi: 10.1210/en.2011-1312. Epub 2011 Nov 8. Endocrinology. 2012. PMID: 22067315 Free PMC article.
-
Dissection of corticotropin-releasing factor system involvement in locomotor sensitivity to methamphetamine.Genes Brain Behav. 2011 Feb;10(1):78-89. doi: 10.1111/j.1601-183X.2010.00641.x. Epub 2010 Sep 30. Genes Brain Behav. 2011. PMID: 20731720 Free PMC article.
-
Major depressive disorder: hypothesis, mechanism, prevention and treatment.Signal Transduct Target Ther. 2024 Feb 9;9(1):30. doi: 10.1038/s41392-024-01738-y. Signal Transduct Target Ther. 2024. PMID: 38331979 Free PMC article. Review.
-
Posterodorsal Medial Amygdala Urocortin-3, GABA, and Glutamate Mediate Suppression of LH Pulsatility in Female Mice.Endocrinology. 2022 Dec 19;164(2):bqac196. doi: 10.1210/endocr/bqac196. Endocrinology. 2022. PMID: 36445688 Free PMC article.
References
-
- Charmandari E, Tsigos C, Chrousos G. Endocrinology of the stress response. Annu Rev Physiol. 2005;67:259–284. - PubMed
-
- Kyrou I, Tsigos C. Stress mechanisms and metabolic complications. Horm Metab Res. 2007;39:430–438. - PubMed
-
- Carroll D, et al. Generalized anxiety disorder is associated with metabolic syndrome in the Vietnam experience study. Biol Psychiatry. 2009;66:91–93. - PubMed
-
- Bale TL, Vale WW. CRF and CRF receptors: Role in stress responsivity and other behaviors. Annu Rev Pharmacol Toxicol. 2004;44:525–557. - PubMed
Publication types
MeSH terms
Substances
LinkOut - more resources
Full Text Sources
Medical
Molecular Biology Databases
