

A commonly carried allele of the obesity-related FTO gene is associated with reduced brain volume in the healthy elderly
- PMID: 20404173
- PMCID: PMC2889537
- DOI: 10.1073/pnas.0910878107
A commonly carried allele of the obesity-related FTO gene is associated with reduced brain volume in the healthy elderly
Abstract
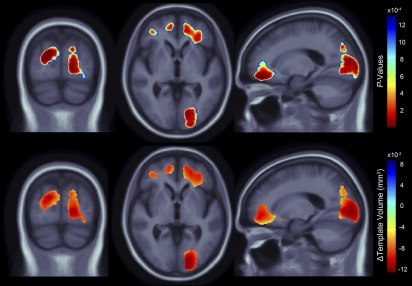
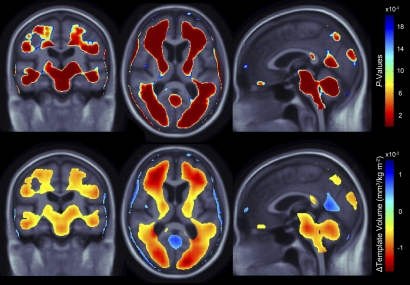
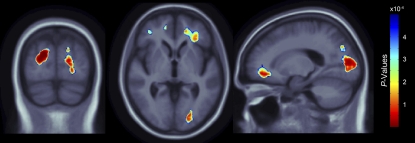
A recently identified variant within the fat mass and obesity-associated (FTO) gene is carried by 46% of Western Europeans and is associated with an approximately 1.2 kg higher weight, on average, in adults and an approximately 1 cm greater waist circumference. With >1 billion overweight and 300 million obese persons worldwide, it is crucial to understand the implications of carrying this very common allele for the health of our aging population. FTO is highly expressed in the brain and elevated body mass index (BMI) is associated with brain atrophy, but it is unknown how the obesity-associated risk allele affects human brain structure. We therefore generated 3D maps of regional brain volume differences in 206 healthy elderly subjects scanned with MRI and genotyped as part of the Alzheimer's Disease Neuroimaging Initiative. We found a pattern of systematic brain volume deficits in carriers of the obesity-associated risk allele versus noncarriers. Relative to structure volumes in the mean template, FTO risk allele carriers versus noncarriers had an average brain volume difference of approximately 8% in the frontal lobes and 12% in the occipital lobes-these regions also showed significant volume deficits in subjects with higher BMI. These brain differences were not attributable to differences in cholesterol levels, hypertension, or the volume of white matter hyperintensities; which were not detectably higher in FTO risk allele carriers versus noncarriers. These brain maps reveal that a commonly carried susceptibility allele for obesity is associated with structural brain atrophy, with implications for the health of the elderly.
Conflict of interest statement
The authors declare no conflict of interest.
Figures
References
-
- Must A, et al. The disease burden associated with overweight and obesity. JAMA. 1999;282:1523–1529. - PubMed
-
- WHO . Obesity and Overweight. Geneva: World Health Organization; 2009.
-
- Ceska R. Clinical implications of the metabolic syndrome. Diab Vasc Dis Res. 2007;4(Suppl 3):S2–S4. - PubMed
-
- Elias MF, Elias PK, Sullivan LM, Wolf PA, D'Agostino RB. Obesity, diabetes and cognitive deficit: The Framingham Heart Study. Neurobiol Aging. 2005;26(Suppl 1):11–16. - PubMed
-
- Maes HH, Neale MC, Eaves LJ. Genetic and environmental factors in relative body weight and human adiposity. Behav Genet. 1997;27:325–351. - PubMed
Publication types
MeSH terms
Substances
Grants and funding
- K01 AG030514/AG/NIA NIH HHS/United States
- U24 AG021886/AG/NIA NIH HHS/United States
- F31 MH087061/MH/NIMH NIH HHS/United States
- P50 AG005133/AG/NIA NIH HHS/United States
- P30 AG010129/AG/NIA NIH HHS/United States
- P30 AG019610/AG/NIA NIH HHS/United States
- R21 RR019771/RR/NCRR NIH HHS/United States
- R01 LM005639/LM/NLM NIH HHS/United States
- R01 AG027342/AG/NIA NIH HHS/United States
- U01 AG024904/AG/NIA NIH HHS/United States
- U19 AG010483/AG/NIA NIH HHS/United States
- HD050735/HD/NICHD NIH HHS/United States
- EB01651/EB/NIBIB NIH HHS/United States
- 1-T90-DA022768:02/DA/NIDA NIH HHS/United States
- RR019771/RR/NCRR NIH HHS/United States
- P50 AG016570/AG/NIA NIH HHS/United States
- G016570/PHS HHS/United States
- R01 HD050735/HD/NICHD NIH HHS/United States
- 1F31MH087061/MH/NIMH NIH HHS/United States
- R01 AG020098/AG/NIA NIH HHS/United States
- LM05639/LM/NLM NIH HHS/United States
- R01 NS059873/NS/NINDS NIH HHS/United States
- T90 DA022768/DA/NIDA NIH HHS/United States
LinkOut - more resources
Full Text Sources
Other Literature Sources
Medical
