. 2010 May 4;107(18):8352-6.
doi: 10.1073/pnas.0907676107. Epub 2010 Apr 19.

Preclinical model of organotypic culture for pharmacodynamic profiling of human tumors

Affiliations

Preclinical model of organotypic culture for pharmacodynamic profiling of human tumors

Valentina Vaira et al. Proc Natl Acad Sci U S A. .

Abstract

Predicting drug response in cancer patients remains a major challenge in the clinic. We have perfected an ex vivo, reproducible, rapid and personalized culture method to investigate antitumoral pharmacological properties that preserves the original cancer microenvironment. Response to signal transduction inhibitors in cancer is determined not only by properties of the drug target but also by mutations in other signaling molecules and the tumor microenvironment. As a proof of concept, we, therefore, focused on the PI3K/Akt signaling pathway, because it plays a prominent role in cancer and its activity is affected by epithelial-stromal interactions. Our results show that this culture model preserves tissue 3D architecture, cell viability, pathway activity, and global gene-expression profiles up to 5 days ex vivo. In addition, we show pathway modulation in tumor cells resulting from pharmacologic intervention in ex vivo culture. This technology may have a significant impact on patient selection for clinical trials and in predicting response to small-molecule inhibitor therapy.


Conflict of interest statement

The authors declare no conflict of interest.

Figures

Fig. 1.
Fig. 1.
Schematic overview of the experimental design.
Fig. 2.
Fig. 2.
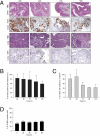
Evaluation of tumor morphology, proliferation, viability, and apoptosis in organotypic tissue cultures. Tissue slices (400-μm thick) were cultured on organotypic supports in serum-supplemented media up to 120 h after surgical explants from patients. A selection of 42 cultured tumors was investigated for proliferative activity (Ki67 immunohistochemistry), tissue viability (MTT assay), and cell death (TUNEL assay) every 24 h. Two representative organotypic tissue cultures from colon and lung tumors are depicted in A. (Magnification: 250× and 100×, respectively.) Evaluation of Ki67 immunoreactivity in cultures (percent of positive cells relative to corresponding uncultured sample; T0) is shown in B, tissue viability is represented in C, and apoptosis is shown in D.
Fig. 3.
Fig. 3.
PI3K–AKT pathway analysis in organotypic tissue cultures. The expression levels and the phosphorylation status of PI3K-pathway members were investigated in a subset of tissue cultures (16 neoplastic samples and 7 matched normal counterparts) up to 96 h. mRNA levels of PI3K, AKT1, and ribosomal protein S6 kinase were quantified by real-time RT-PCR (A). Averaged relative quantities of targets are indicated as fold changes relative to the corresponding T0 sample (RQ ± SEM). The active status of AKT and S6 ribosomal protein (S6RP) was investigated by phospho-immunohistochemistry (p-IHC) every 24 h. Immunoreactivity of tumoral and normal cultured slices (B and C, respectively) was compared with the matched T0 samples. (Magnification: 100×.) Results are indicated in histograms as averaged p-IHC score per time point (n fold T0 ± SEM).
Fig. 4.
Fig. 4.
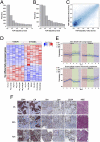
Gene-expression analysis of tumor and stromal samples over time. A and B show histograms of the FDR-adjusted P values indicating stability of gene expression over time for tumor and stromal samples, respectively. The smaller a gene’s P value, then the more conserved is its expression in time. Thus, more than one-half (∼10,000) of the total number of transcripts show conserved expression in our dataset. In C, bivariate distribution of tumor and stroma P values for every gene is plotted with a density map. The blue density depicts the concentration of genes at any given location. Clearly, most genes lie along the diagonal, indicating correlation in the stability of their tumor and stroma expressions. Notably, the cluster of dark points near the origin (0.0) represents stable expressions for more than one-half of the transcripts. In D, the expression of the top 143 differentially expressed genes that are significant at P value level 0.01 is plotted with a heatmap. The colors blue and red depict low and high expression, respectively. The plots in E show (blue line) the loess-smoothed expression profiles of two gene sets, non–small-cell lung cancer and extracellular matrix cellular constituent, distinctive of tumor and stromal compartments, respectively. The SE gray band and the cross-sample median line are shown for perspective. For each of these gene sets, the distinction between the mean profiles of tumor and stroma classes was found to be statistically significant. F shows microphotographs of a lung tumor at 0 h, 24 h, and 72 h of culture. H&E staining shows morphological integrity, CD34 highlights endothelial cells, laminin stains basal membranes, vimentin is an intermediate filament protein found in cells of mesenchymal origin, and cytokeratin and EMA label epithelial cells. (Magnification: 100×; Inset magnification: 250×.)
Fig. 5.
Fig. 5.
PI3K-targeted therapy with an LY294002 inhibitor. In AC, tumor tissue cultures were incubated with 50 μm of LY29004 up to 96 h. Slices were harvested every 24 h, and drug effects on PI3K pathway (A, p-AKT; B, p-S6RP-IHC) were tested. Images of both phospho-protein immunostaining in a representative case of lung tumor are shown in C. (Magnification: 100×.) D and E show the results of a dose-response experiment on cell proliferation and PI3K pathway, respectively, using increasing doses of LY294002. (Magnification: 100×.)

References

    1. Patocs A, et al. Breast-cancer stromal cells with TP53 mutations and nodal metastases. N Engl J Med. 2007;357:2543–2551. - PubMed
    1. Orimo A, Weinberg RA. Stromal fibroblasts in cancer: A novel tumor-promoting cell type. Cell Cycle. 2006;5:1597–1601. - PubMed
    1. Peehl DM. Primary cell cultures as models of prostate cancer development. Endocr Relat Cancer. 2005;12:19–47. - PubMed
    1. Guyot C, Combe C, Clouzeau-Girard H, Moronvalle-Halley V, Desmoulière A. Specific activation of the different fibrogenic cells in rat cultured liver slices mimicking in vivo situations. Virchows Arch. 2007;450:503–512. - PubMed
    1. Schmeichel KL, Bissell MJ. Modeling tissue-specific signaling and organ function in three dimensions. J Cell Sci. 2003;116:2377–2388. - PMC - PubMed

Publication types

Substances