. 2010 May 4;107(18):8486-91.
doi: 10.1073/pnas.1002499107. Epub 2010 Apr 19.

Broadly heterogeneous activation of the master regulator for sporulation in Bacillus subtilis

Affiliations

Broadly heterogeneous activation of the master regulator for sporulation in Bacillus subtilis

Arnaud Chastanet et al. Proc Natl Acad Sci U S A. .

Abstract

A model system for investigating how developmental regulatory networks determine cell fate is spore formation in Bacillus subtilis. The master regulator for sporulation is Spo0A, which is activated by phosphorylation via a phosphorelay that is subject to three positive feedback loops. The ultimate decision to sporulate is, however, stochastic in that only a portion of the population sporulates even under optimal conditions. It was previously assumed that activation of Spo0A and hence entry into sporulation is subject to a bistable switch mediated by one or more feedback loops. Here we reinvestigate the basis for bimodality in sporulation. We show that none of the feedback loops is rate limiting for the synthesis and phosphorylation of Spo0A. Instead, the loops ensure a just-in-time supply of relay components for rising levels of phosphorylated Spo0A, with phosphate flux through the relay being limiting for Spo0A activation and sporulation. In addition, genes under Spo0A control did not exhibit a bimodal pattern of expression as expected for a bistable switch. In contrast, we observed a highly heterogeneous pattern of Spo0A activation that increased in a nonlinear manner with time. We present a computational model for the nonlinear increase and propose that the phosphorelay is a noise generator and that only cells that attain a threshold level of phosphorylated Spo0A sporulate.


Conflict of interest statement

The authors declare no conflict of interest.

Figures

Fig. 1.
Fig. 1.
An intricate genetic circuitry controls 0A production and activation. (A) The network of feedback loops controlling 0A~P. Purple lines highlight the AbrB/σH pathway for transcription of the genes for KinA, 0F, and 0A. Orange lines highlight the AbrB/0E pathway promoting dephosphorylation of 0A~P. The blue and green lines identify positive feedback loops that stimulate transcription of the genes for 0A and 0F, respectively, via the accumulation of 0A~P. (B) A noise model for the generation of heterogeneity in 0A~P levels during sporulation. The 0A~P ┤AbrB → σH → 0A pathway is depicted in light gray because σH levels rise before sporulation starts. Because 0A and 0F levels are also not limiting, positive feedback loops governing their synthesis are “just-in-time” circuits (red) that maintain adequate supplies of both proteins as 0A~P levels rise. The 0E circuit (blue) imposes a time delay that impedes the accumulation of 0A~P at the start of sporulation. Finally, and most importantly, we propose that flux of phosphate through the relay is noisy and is responsible for the heterogeneity in 0A~P levels.
Fig. 2.
Fig. 2.
The AbrB/σH pathway contributes negligibly to 0A~P accumulation. (A) Kinetics of accumulation of 0A, AbrB, and σH during sporulation. Blots were performed using samples of wild-type cells taken at the indicated times before and after suspension in sporulation-inducing synthetic minimal (SM) medium (Right) (25). Samples from cells mutant for spo0A0A; Abs549) and abrBabrB; RL3660) were taken immediately before suspension (Left). Equal amounts of protein, as quantified by the Bradford technique, were loaded as verified by the control immunoblot using anti-σA antibodies (Top). (B) σH accumulates to high levels even when AbrB levels remain high. Equivalent amounts of protein from wild type (wt) or mutant (mut; ΔPvegspo0A) strains were loaded and analyzed using anti-0A, -σH, -AbrB, and -σA antibodies. (C) Model for the interplay of AbrB, AbbA, 0A~P, and σH from growth into sporulation. Arrow indicates transcriptional stimulation. Bars indicate repression or in the case of AbbA inhibition of AbrB protein. Font size conveys relative abundance of proteins. *Unknown posttranscriptional control of σH accumulation.
Fig. 3.
Fig. 3.
Phosphate flux but not 0A or 0F levels is limiting for sporulation. (A) Sporulation was monitored by measuring the percentage of cells that had reached the stage of asymmetric division or beyond (Inset: arrows label asymmetric septa). Samples of wild-type cells suspended in synthetic minimal (SM) medium were collected, stained with Mito Tracker Green, and observed microscopically. A minimum of 500 cells was counted for each time point here and below. (B) Phosphate flux but not the initial level of 0A is limiting for sporulation. Sporulation was monitored as in A using wild-type (wt) cells, cells constitutively overexpressing spo0A because of a promoter up-mutation (Pup-0A), cells mutant for spo0Espo0E; spo0E::Km), cells overexpressing kinA (PHy-kinA; kinA::PHy-kinA), or cells overexpressing kinC (PHy-kinC; kinC::PHy-kinC). Expression of PHy-kinA and PHy-kinC were induced at the time of suspension in SM medium (time 0) by the addition of 1 mM (final concentration) IPTG. Inset: 0A levels were enhanced in the spo0A overexpression strain as measured by immunoblot analysis using anti-0A antibodies; samples of wild-type (wt) or Pup-0A cells were collected at the time of suspension (time 0). Equal amounts of protein were analyzed as demonstrated with anti-σA antibodies. (C) 0F levels are not limiting for sporulation. Sporulation was monitored as in A with wild-type (wt) cells, cells overexpressing spo0A with Pup-0A, cells overexpressing spo0A with Pspac-0A, cells overexpressing spo0F in a spo0F mutant background (0F::PHy-0F), cells overexpressing spo0F in spo0F+ background (amyE::PHy-0F), and in cells overexpressing both spo0A and spo0F (Pup-0A, amyE::PHy-0F). Pspac-0A and PHy-0F were induced 30 min before suspension by the addition of 1 mM IPTG (final concentration) for spo0A, or by a varying concentration of IPTG (numbers correspond to μM concentration) for spo0F.
Fig. 4.
Fig. 4.
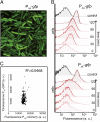
0A-directed gene expression is broadly heterogeneous. (A) Visualization of amyE::PIIA-gfp expression by fluorescence microscopy 1 h after induction of sporulation. (B) FACS analysis of cells harboring amyE::PIIA-gfp (Upper) or amyE::PIIE-gfp (Lower). The cells were grown in Casein Hydrolysate (CH) rich medium and suspended in SM medium at the midexponential phase of growth. Cells were collected at the indicated times after suspension and prepared for FACS analysis as described in Materials and Methods. The control (gray) was FACS analysis with wild-type cells lacking gfp. (C) Heterogeneity in a late 0A-target expression is uncorrelated with extrinsic noise. Green and red fluorescence were quantified in PIIA-gfp - PHy-mCherry ABS1317 cells (amyE::PIIA-gfp ylnF::Tn917::amyE::cat::PHy-mCherry). For this, mcherry was induced using a final concentration of 1 mM IPTG 1 h before induction for sporulation, and images were collected 90 min after sporulation induction. Average fluorescence intensity in individual cells was calculated on >500 cells using Metamorph software on a 10-pix2 area replicated from “red” picture to “green” picture.
Fig. 5.
Fig. 5.
Effect of phosphate flux on 0A activity and prediction of 0A~P accumulation by computational modeling. (A) FACS analysis of the effect of KinA and 0E on PIIA-gfp expression. As in Fig. 4B except that samples were collected every 15 min as indicated. Cell distributions were determined for strains harboring amyE::PIIA-gfp. The strains were otherwise wild type (wt), mutant for spo0Espo0E), overexpressing kinA (kinA::PHy-kinA), or mutant for spo0E and overexpressing kinA (kinA::PHy-kinA ; Δspo0E). Induction was performed by adding 1 mM IPTG (final concentration) at the time of suspension (time 0). Dotted lines were arbitrarily placed at 70 a.u. to serve as a reference to highlight the shifting of the peak numbers of fluorescent cells. (B) The increase in mean fluorescence is nonlinear and is delayed by 0E activity. From data collected during FACS analysis (A), mean fluorescence was calculated for each distribution diagram and plotted as a function of time. Blue symbols correspond to wild type, red to Δspo0E, green to kinA::PHy-kinA, and purple to kinA::PHy-kinA, Δspo0E. (C) 0E and variations in phosphate flux contribute to heterogeneity in PIIA-gfp expression. From data collected during FACS analysis (A), the CV (defined as the ratio of the distribution SD to its mean) was calculated for each distribution diagram and plotted as a function of time. Blue symbols correspond to wild type, red to Δspo0E, and green to kinA::PHy-kinA. (D and E) Predicted kinetics of 0A~P accumulation calculated to fit to the mean fluorescence in wt (■), Δspo0E (◆), kinA::PHy-kinA (●), and kinA::PHy-kinA ; Δspo0E (▲), assuming that mean fluorescence was proportional to the level of 0A~P. Gray curves are experimental data (B; mean fluorescence), and dotted red curves are predictions. Model 1 (D) assumes a linear increase of all relay components and model 2 (E) assumes that + feedback loops driven by 0A~P govern increase in KinA, 0F, 0B, and 0A.

References

    1. Chai Y, Chu F, Kolter R, Losick R. Bistability and biofilm formation in Bacillus subtilis. Mol Microbiol. 2008;67:254–263. - PMC - PubMed
    1. Dubnau D, Losick R. Bistability in bacteria. Mol Microbiol. 2006;61:564–572. - PubMed
    1. Kearns DB, Losick R. Cell population heterogeneity during growth of Bacillus subtilis. Genes Dev. 2005;19:3083–3094. - PMC - PubMed
    1. Maamar H, Raj A, Dubnau D. Noise in gene expression determines cell fate in Bacillus subtilis. Science. 2007;317:526–529. - PMC - PubMed
    1. Fujita M, Losick R. Evidence that entry into sporulation in Bacillus subtilis is governed by a gradual increase in the level and activity of the master regulator Spo0A. Genes Dev. 2005;19:2236–2244. - PMC - PubMed

Publication types

MeSH terms

LinkOut - more resources