

Linking global climate and temperature variability to widespread amphibian declines putatively caused by disease
- PMID: 20404180
- PMCID: PMC2889522
- DOI: 10.1073/pnas.0912883107
Linking global climate and temperature variability to widespread amphibian declines putatively caused by disease
Abstract
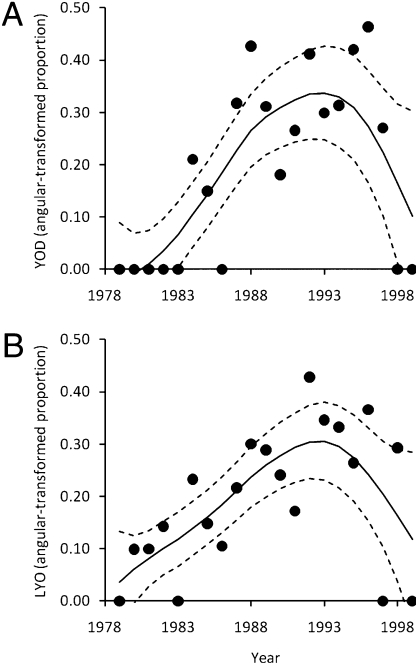
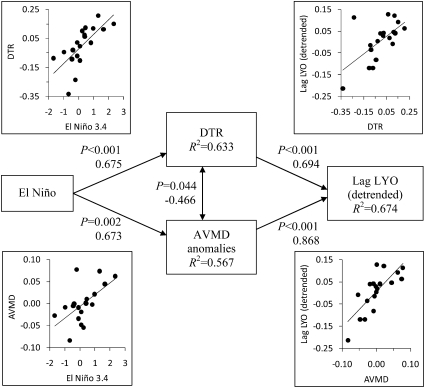
The role of global climate change in the decline of biodiversity and the emergence of infectious diseases remains controversial, and the effect of climatic variability, in particular, has largely been ignored. For instance, it was recently revealed that the proposed link between climate change and widespread amphibian declines, putatively caused by the chytrid fungus Batrachochytrium dendrobatidis (Bd), was tenuous because it was based on a temporally confounded correlation. Here we provide temporally unconfounded evidence that global El Niño climatic events drive widespread amphibian losses in genus Atelopus via increased regional temperature variability, which can reduce amphibian defenses against pathogens. Of 26 climate variables tested, only factors associated with temperature variability could account for the spatiotemporal patterns of declines thought to be associated with Bd. Climatic predictors of declines became significant only after controlling for a pattern consistent with epidemic spread (by temporally detrending the data). This presumed spread accounted for 59% of the temporal variation in amphibian losses, whereas El Niño accounted for 59% of the remaining variation. Hence, we could account for 83% of the variation in declines with these two variables alone. Given that global climate change seems to increase temperature variability, extreme climatic events, and the strength of Central Pacific El Niño episodes, climate change might exacerbate worldwide enigmatic declines of amphibians, presumably by increasing susceptibility to disease. These results suggest that changes to temperature variability associated with climate change might be as significant to biodiversity losses and disease emergence as changes to mean temperature.
Conflict of interest statement
The authors declare no conflict of interest.
Figures


References
-
- Raisanen J. CO2-induced changes in interannual temperature and precipitation variability in 19 CMIP2 experiments. J Clim. 2002;15:2395–2411.
-
- Daszak P, Cunningham AA, Hyatt AD. Emerging infectious diseases of wildlife: Threats to biodiversity and human health. Science. 2000;287:443–449. - PubMed
Publication types
MeSH terms
LinkOut - more resources
Full Text Sources
Medical
Molecular Biology Databases
