

Noncanonical interactions between serum transferrin and transferrin receptor evaluated with electrospray ionization mass spectrometry
- PMID: 20404192
- PMCID: PMC2889525
- DOI: 10.1073/pnas.0914898107
Noncanonical interactions between serum transferrin and transferrin receptor evaluated with electrospray ionization mass spectrometry
Abstract
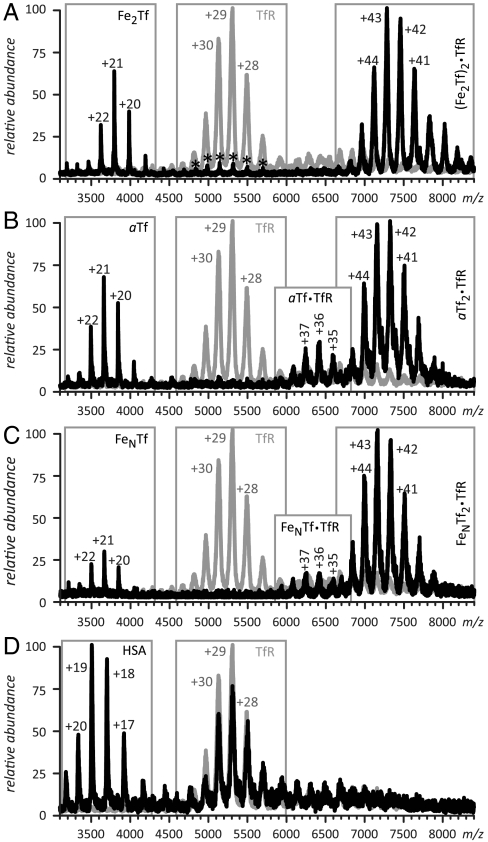
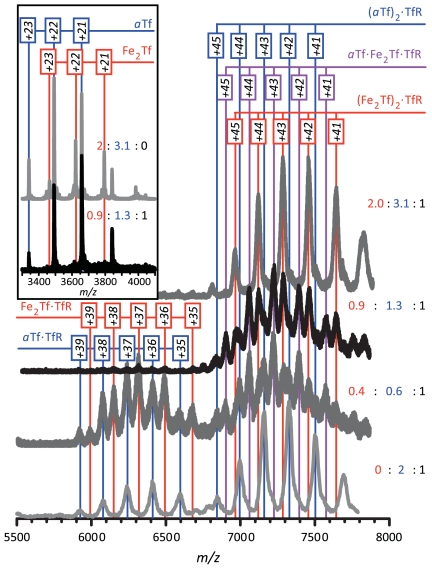
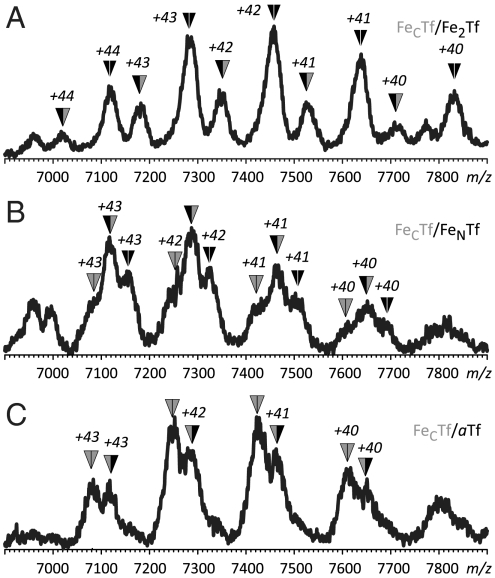
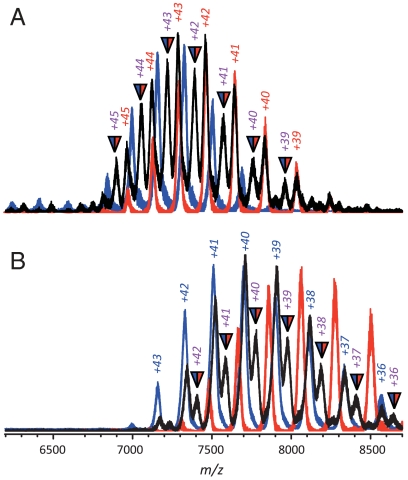
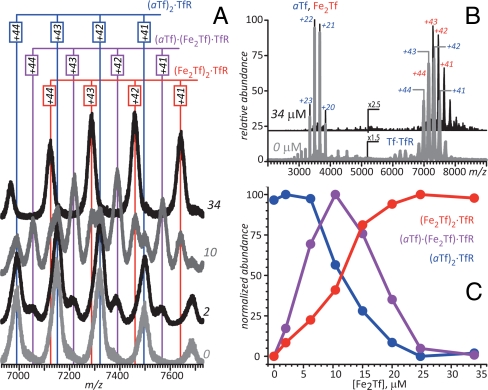
The primary route of iron acquisition in vertebrates is the transferrin receptor (TfR) mediated endocytotic pathway, which provides cellular entry to the metal transporter serum transferrin (Tf). Despite extensive research efforts, complete understanding of Tf-TfR interaction mechanism is still lacking owing to the complexity of this system. Electrospray ionization mass spectrometry (ESI MS) is used in this study to monitor the protein/receptor interaction and demonstrate the ability of metal-free Tf to associate with TfR at neutral pH. A set of Tf variants is used in a series of competition and displacement experiments to bracket TfR affinity of apo-Tf at neutral pH (0.2-0.6 microM). Consistent with current models of endosomal iron release from Tf, acidification of the protein solution results in a dramatic change of binding preferences, with apo-Tf becoming a preferred receptor binder. Contrary to the current models implying that the apo-Tf/TfR complex dissociates almost immediately upon exposure to the neutral environment at the cell surface, our data indicate that this complex remains intact. Iron-loaded Tf displaces apo-Tf from TfR, making it available for the next cycle of iron binding, transport and delivery to tissues. However, apo-Tf may still interfere with the cellular uptake of engineered Tf molecules whose TfR affinity is affected by various modifications (e.g., conjugation to cytotoxic molecules). This work also highlights the great potential of ESI MS as a tool capable of providing precise details of complex protein-receptor interactions under conditions that closely mimic the environment in which these encounters occur in physiological systems.
Conflict of interest statement
The authors declare no conflict of interest.
Figures
References
-
- Dunn LL, Rahmanto YS, Richardson DR. Iron uptake and metabolism in the new millennium. Trends Cell Biol. 2007;17:93–100. - PubMed
-
- Lambert LA, Perri H, Halbrooks PJ, Mason AB. Evolution of the transferrin family: Conservation of residues associated with iron and anion binding. Comp Biochem Physiol B Biochem Mol Biol. 2005;142:129–141. - PubMed
-
- Aisen P. Transferrin receptor 1. Int J Biochem Cell Biol. 2004;36:2137–2143. - PubMed
-
- Daniels TR, Delgado T, Helguera G, Penichet ML. The transferrin receptor part II: Targeted delivery of therapeutic agents into cancer cells. Clin Immunol. 2006;121:159–176. - PubMed
-
- Khalaila I, Allardyce CS, Verma CS, Dyson PJ. A mass spectrometric and molecular modelling study of cisplatin binding to transferrin. Chembiochem. 2005;6:1788–1795. - PubMed
Publication types
MeSH terms
Substances
Grants and funding
LinkOut - more resources
Full Text Sources
Other Literature Sources
Molecular Biology Databases
Miscellaneous
