In vivo magnetomotive optical molecular imaging using targeted magnetic nanoprobes
- PMID: 20404194
- PMCID: PMC2889582
- DOI: 10.1073/pnas.0913679107
In vivo magnetomotive optical molecular imaging using targeted magnetic nanoprobes
Abstract
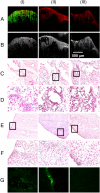
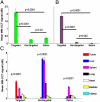
Dynamic magnetomotion of magnetic nanoparticles (MNPs) detected with magnetomotive optical coherence tomography (MM-OCT) represents a new methodology for contrast enhancement and therapeutic interventions in molecular imaging. In this study, we demonstrate in vivo imaging of dynamic functionalized iron oxide MNPs using MM-OCT in a preclinical mammary tumor model. Using targeted MNPs, in vivo MM-OCT images exhibit strong magnetomotive signals in mammary tumor, and no significant signals were measured from tumors of rats injected with nontargeted MNPs or saline. The results of in vivo MM-OCT are validated by MRI, ex vivo MM-OCT, Prussian blue staining of histological sections, and immunohistochemical analysis of excised tumors and internal organs. The MNPs are antibody functionalized to target the human epidermal growth factor receptor 2 (HER2 neu) protein. Fc-directed conjugation of the antibody to the MNPs aids in reducing uptake by macrophages in the reticulo-endothelial system, thereby increasing the circulation time in the blood. These engineered magnetic nanoprobes have multifunctional capabilities enabling them to be used as dynamic contrast agents in MM-OCT and MRI.
Conflict of interest statement
The authors declare no conflict of interest.
Figures


Similar articles
-
Phase-resolved magnetomotive OCT for imaging nanomolar concentrations of magnetic nanoparticles in tissues.Opt Express. 2008 Jul 21;16(15):11525-39. Opt Express. 2008. PMID: 18648474 Free PMC article.
-
Magnetomotive molecular nanoprobes.Curr Med Chem. 2011;18(14):2103-14. doi: 10.2174/092986711795656252. Curr Med Chem. 2011. PMID: 21517766 Free PMC article. Review.
-
Biomechanical sensing of in vivo magnetic nanoparticle hyperthermia-treated melanoma using magnetomotive optical coherence elastography.Theranostics. 2021 Mar 23;11(12):5620-5633. doi: 10.7150/thno.55333. eCollection 2021. Theranostics. 2021. PMID: 33897871 Free PMC article.
-
Magnetomotive Displacement of the Tympanic Membrane Using Magnetic Nanoparticles: Toward Enhancement of Sound Perception.IEEE Trans Biomed Eng. 2018 Dec;65(12):2837-2846. doi: 10.1109/TBME.2018.2819649. Epub 2018 Mar 26. IEEE Trans Biomed Eng. 2018. PMID: 29993404 Free PMC article.
-
Magnetic nanoparticles as both imaging probes and therapeutic agents.Curr Top Med Chem. 2010;10(12):1184-97. doi: 10.2174/156802610791384207. Curr Top Med Chem. 2010. PMID: 20388109 Review.
Cited by
-
Magnetoacoustic imaging of magnetic iron oxide nanoparticles embedded in biological tissues with microsecond magnetic stimulation.Appl Phys Lett. 2012 Jan 2;100(1):13704-137043. doi: 10.1063/1.3675457. Epub 2012 Jan 6. Appl Phys Lett. 2012. PMID: 22271933 Free PMC article.
-
Nanomedicine: a primer for surgeons.Pediatr Surg Int. 2012 Oct;28(10):943-51. doi: 10.1007/s00383-012-3162-y. Epub 2012 Aug 15. Pediatr Surg Int. 2012. PMID: 22892910 Free PMC article. Review.
-
Magnetic particles in motion: magneto-motive imaging and sensing.Theranostics. 2022 Jan 24;12(4):1783-1799. doi: 10.7150/thno.54056. eCollection 2022. Theranostics. 2022. PMID: 35198073 Free PMC article. Review.
-
In Vivo Molecular Optical Coherence Tomography of Lymphatic Vessel Endothelial Hyaluronan Receptors.Sci Rep. 2017 Apr 24;7(1):1086. doi: 10.1038/s41598-017-01172-x. Sci Rep. 2017. PMID: 28439123 Free PMC article.
-
Detection of magnetic particles in live DBA/2J mouse eyes using magnetomotive optical coherence tomography.Eye Contact Lens. 2010 Nov;36(6):346-51. doi: 10.1097/ICL.0b013e3181f57c51. Eye Contact Lens. 2010. PMID: 21060257 Free PMC article.
References
-
- Graves EE, Weissleder R, Ntziachristos V. Fluorescence molecular imaging of small animal tumor models. Curr Mol Med. 2004;4:419–430. - PubMed
-
- Bulte JWM, Kraitchman DL. Iron oxide MR contrast agents for molecular and cellular imaging. NMR Biomed. 2004;17:484–494. - PubMed
-
- Liu J, et al. Nanoparticles as image enhancing agents for ultrasonography. Phys Med Biol. 2006;51:2179–2189. - PubMed
-
- Luker GD, Piwnica-Worms D. Molecular imaging in vivo with PET and SPECT. Acad Radiol. 2001;8:4–14. - PubMed
Publication types
MeSH terms
Substances
Grants and funding
LinkOut - more resources
Full Text Sources
Other Literature Sources
Research Materials
Miscellaneous

