. 2010 Jun 11;285(24):18737-48.
doi: 10.1074/jbc.M109.091694. Epub 2010 Apr 19.

Induction of reactive oxygen species-mediated autophagy by a novel microtubule-modulating agent

Affiliations

Induction of reactive oxygen species-mediated autophagy by a novel microtubule-modulating agent

Prasanthi Karna et al. J Biol Chem. .

Abstract

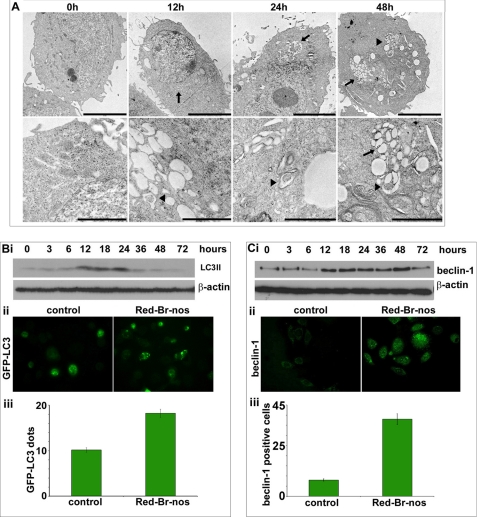
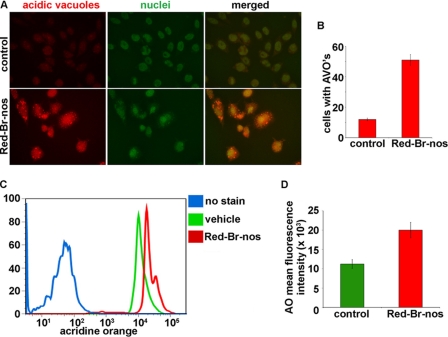
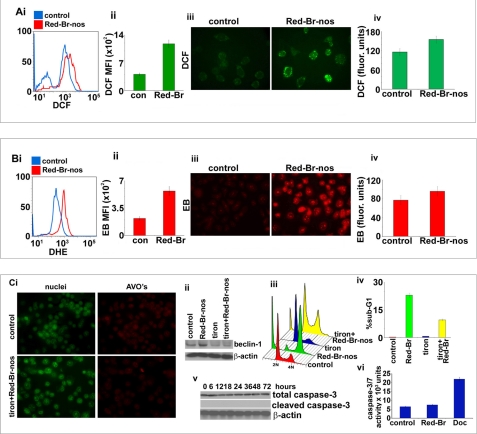
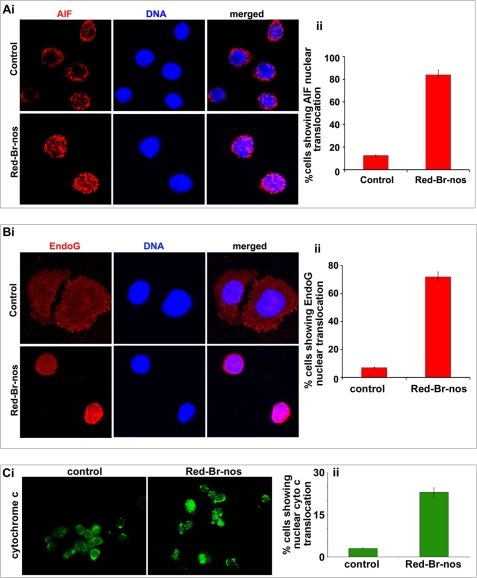
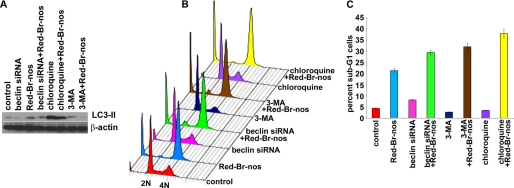
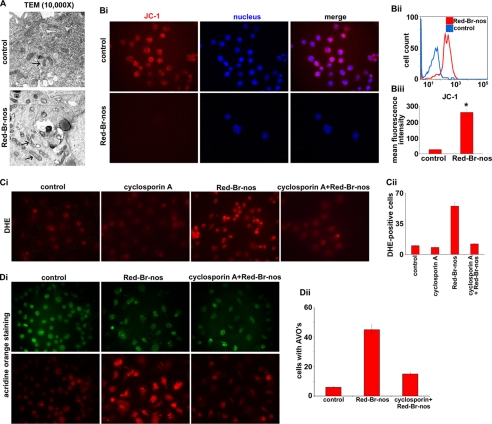
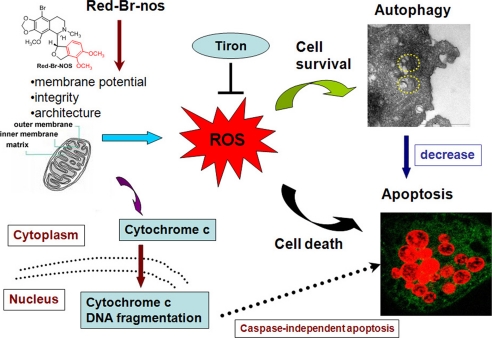
Autophagy is being increasingly implicated in both cell survival and death. However, the intricate relationships between drug-induced autophagy and apoptosis remain elusive. Here we demonstrate that a tubulin-binding noscapine analog, (R)-9-bromo-5-((S)-4,5-dimethoxy-1,3-dihydroisobenzofuran-1-yl)-4-methoxy-6-methyl-5,6,7,8-tetrahydro-[1,3]-di-oxolo[4,5-g]isoquinoline (Red-Br-nos), exerts a novel autophagic response followed by apoptotic cell death in human prostate cancer PC-3 cells. Red-Br-nos-induced autophagy was an early event detectable within 12 h that displayed a wide array of characteristic features including double membranous vacuoles with entrapped organelles, acidic vesicular organelles, and increased expression of LC3-II and beclin-1. Red-Br-nos-triggered release of reactive oxygen species (ROS) and attenuation of ROS by tiron, a ROS scavenger, reduced the sub-G(1) population suggesting ROS-dependent apoptosis. Abrogation of ROS also reduced autophagy indicating that ROS triggers autophagy. Pharmacological and genetic approaches to inhibit autophagy uncovered the protective role of Red-Br-nos-induced autophagy in PC-3 cells. Direct effects of the drug on mitochondria viz. disruption of normal cristae architecture and dissipation of mitochondrial transmembrane potential revealed a functional link between ROS generation, autophagy, and apoptosis induction. This is the first report to demonstrate the protective role of ROS-mediated autophagy and induction of caspase-independent ROS-dependent apoptosis in PC-3 cells by Red-Br-nos, a member of the noscapinoid family of microtubule-modulating anticancer agents.


Figures

FIGURE 1.
FIGURE 1.
Red-Br-nos induces robust autophagy in prostate cancer PC-3 cells. Panel A, representative transmission electron micrographs showing the ultrastructure of PC-3 cells treated with DMSO (controls) or 25 μm Red-Br-nos for the indicated time points. Note the abundance of double membrane vacuoles (black arrowheads) in Red-Br-nos-treated PC-3 cells, which were infrequently seen in controls. Remnants of organelles, including mitochondria (black arrows) were evident in some of these double membrane autophagic vacuoles. Upper panels, scale bar = 5 μm; lower panels, scale bar = 2 μm. Panel B, i, immunoblot analysis of LC3-II expression levels in lysates from PC-3 cells treated with 25 μm Red-Br-nos for the indicated time points. β-Actin was used to ensure equal protein loading. Similar results were observed in at least two independent experiments. Panel ii, immunofluorescence micrographs showing GFP-LC3 plasmid-transfected cells treated in the absence or presence of Red-Br-nos. Panel iii, GFP-LC3 dots were counted to quantify autophagic cells (24-h drug treatment) from 6 to 8 random image fields totaling 200 cells and reported as mean ± S.D. (p < 0.05, compared with controls). Panel C, i, immunoblot analysis of beclin-1 expression levels in drug-treated PC-3 cells for the indicated time points. β-Actin was a loading control. Panel ii, immunofluorescence micrographs showing beclin-1-stained PC-3 cells treated in the presence (right) or absence of Red-Br-nos (left). Panel iii, quantitation of beclin-1 positive cells in control and 24-h drug-treated PC-3 cells from random image fields totaling 200 cells and reported as mean ± S.D. (p < 0.05, compared with controls).
FIGURE 2.
FIGURE 2.
Panel A, immunofluorescence microscopy of acridine orange-stained PC-3 cells treated for 24 h with DMSO (control) or 25 μm Red-Br-nos. Increase in number of cells with AO accumulating acidic vesicular organelles (orange-red fluorescence) in Red-Br-nos-treated cells was evident. Panel B, quantitation of cells with AVOs from 6 to 8 random image fields totaling ∼200 cells and reported as mean ± S.D. (p < 0.05). Panel C, histogram profiles of control and Red-Br-nos-treated cells that were read flow cytometrically. Blue profile shows unstained cells without AO as negative controls. Green profile depicts control cells that were stained with AO and the red profile shows drug-treated cells with increased AO fluorescence, indicative of numerous red AVOs. Panel D, bar graph representation of the quantitation of the mean fluorescence intensity in control and drug-treated PC-3 cells. Columns, mean ± S.D. (p < 0.05, compared with controls).
FIGURE 3.
FIGURE 3.
Red-Br-nos-triggered ROS generation in PC-3 cells. Panel A, i, histogram profiles of control and drug-treated cells that were read flow cytometrically upon DCFDA staining (an indicator of ROS generation). Panel ii, bar graph representation of the quantitation of the increase in the mean fluorescence intensity (DCF-positive cells) in PC-3 cultures treated with DMSO (control) or Red-Br-nos for 24 h. Columns, mean ± S.D. (*, p < 0.05, compared with controls). Panel iii, microscopic visualization of DCF fluorescence in control and drug-treated PC-3 cells. Panel iv, fluorimetric data showing an increase in DCF fluorescence upon drug treatment compared with controls. Panel B, i, flow cytometric histogram profiles of control (blue profile) and drug-treated (red profile) cells upon DHE staining (another indicator of ROS generation). Panel ii, bar graph representation of the quantitation of the increase in the mean fluorescence intensity (EtBr-positive cells) in PC-3 cultures treated with DMSO (control) or Red-Br-nos for 24 h. Panel iii, microscopic visualization of EtBr (EB) fluorescence in control and drug-treated PC-3 cells. Panel iv, fluorimetric data showing an increase in EtBr fluorescence upon drug treatment compared with controls. Panel C, i, attenuation of ROS by tiron reduced the autophagic response as seen by a decrease in the number of red acidic compartments (AVOs), a characteristic feature of autophagic vacuoles. Panel ii, abrogation of ROS by tiron also decreased beclin-1 expression levels upon Red-Br-nos treatment for 24 h, suggesting a clear involvement of ROS in induction of autophagy. Panel iii, ROS plays a role in inducing Red-Br-nos-induced apoptosis. Attenuating ROS levels by tiron reduced the sub-G1 population as shown in the three-dimensional disposition of cell-cycle profiles. Panel iv, bar graph representation of the quantitation of the sub-G1 population upon drug treatment in the presence or absence of tiron. Panel v shows an immunoblot analysis for total and cleaved caspase-3 at the noted time points. β-Actin was used as a loading control. Panel vi is a bar graph representation for caspase-3/7 activity measured at 24 h upon treatment with vehicle control, Red-Br-nos and docetaxel. Columns, mean ± S.D. (*, p < 0.05, compared with controls).
FIGURE 4.
FIGURE 4.
Red-Br-nos treatment induces caspase-independent cell death in PC-3 cells. Micrographs show immunocytochemical staining of 48 h Red-Br-nos-treated PC-3 cells for AIF (panel A, i), Endo-G (panel B, i), and cytochrome c (panel C, i). Bar graph representation of the quantitation of percent cells showing nuclear AIF translocation (panel A, ii), nuclear Endo-G translocation (panel B, ii) and nuclear cytochrome c translocation (panel C, ii) in control and drug-treated PC-3 cells from 6 to 8 random image fields totaling 200 cells and reported as mean ± S.D. (p < 0.05, compared with controls).
FIGURE 5.
FIGURE 5.
Red-Br-nos induced autophagy protects PC-3 cells from cell death. Panel A, immunoblotting analysis of LC3-II in cells treated with early phase autophagy inhibitors (3-MA and beclin-1 siRNA) and widely claimed late phase autophagy inhibitor (chloroquine). Panel B, a representative depiction of flow histograms to show subdiploid fraction in PC-3 cultures treated for 24 h with DMSO (control) or 25 μm Red-Br-nos in the presence or absence of 3-MA, or beclin-1 siRNA or chloroquine. Panel C, quantitation of the sub-G1 population shows that abrogating autophagy increases the sub-G1 population suggesting a protective role of autophagy induction. Columns, mean ± S.D. (*, p < 0.05, compared with controls).
FIGURE 6.
FIGURE 6.
Red-Br-nos directly affects mitochondria. Panel A, representative transmission electron micrographs of PC-3 cell following a 24-h treatment with DMSO (control) or 25 μm Red-Br-nos (magnification, ×10,000). Control PC-3 cells displayed healthy looking mitochondria with intact cristae structure. However, Red-Br-nos treatment caused disruption of mitochondrial cristae structure (arrow), and a large fraction of mitochondria in Red-Br-nos-treated cells resembled type III mitochondria (52). Panel B, i, fluorescence micrographs of JC-1-stained PC-3 cells showing red JC-1 aggregates in controls, whereas there was a significant reduction in the number of red fluorescent cells indicating disruption of mitochondrial transmembrane potential upon drug treatment. Panel ii, flow cytometric histogram profiles showing percentage of cells with cytosolic monomeric JC-1-associated green fluorescence (indicating collapse of mitochondrial membrane potential) in PC-3 cultures treated with DMSO (control, blue profile) or 25 μm Red-Br-nos (red profile) for 24 h. Representative data from a single experiment, which was repeated three times with similar results, are shown. Panel iii, quantitation of the increase in mean fluorescence intensity (i.e. the percentage of green JC-1-stained cells) in PC-3 cultures treated with DMSO (control) or 25 μm Red-Br-nos for 24 h. Preserving mitochondrial integrity by cyclosporin A pretreatment remarkably attenuates ROS generation as well as autophagy. Panel C, i, cyclosporin A pretreatment was followed by drug treatment and microsopic evaluation of drug-induced ROS generation using DHE staining. Panel ii, quantitation of DHE-stained fluorescent micrographs showed that there was a significant reduction in ethidium bromide fluorescence upon drug treatment after cyclosporin A pretreatment. Cyclosporin A pretreatment yielded attenuated autophagic responses. Panel D, i, immunofluorescence microscopy of acridine orange-stained PC-3 cells pretreated with cyclosporin A for 4 h before treatment with 25 μm Red-Br-nos for 24 h. A significant decrease in the number of cells with acridine orange accumulating acidic vesicular organelles (orange-red fluorescence) in Red-Br-nos-treated cells was seen. Panel ii, quantitation of cells with AVOs from 6 to 8 random image fields totaling 200 cells and reported as mean ± S.D. (p < 0.05, compared with controls).
FIGURE 7.
FIGURE 7.
Schematic diagram illustrates a proposed model depicting the interrelationships of events in drug-induced activation of ROS and autophagy that determine the extent of apoptosis.

Similar articles

Cited by

References

    1. Peng X. H., Karna P., O'Regan R. M., Liu X., Naithani R., Moriarty R. M., Wood W. C., Lee H. Y., Yang L. (2007) Mol. Pharmacol. 71, 101–111 - PubMed
    1. Yu L., Wan F., Dutta S., Welsh S., Liu Z., Freundt E., Baehrecke E. H., Lenardo M. (2006) Proc. Natl. Acad. Sci. U.S.A. 103, 4952–4957 - PMC - PubMed
    1. Levine B. (2005) Cell 120, 159–162 - PubMed
    1. Levine B., Yuan J. (2005) J. Clin. Invest. 115, 2679–2688 - PMC - PubMed
    1. Levine B., Klionsky D. J. (2004) Dev. Cell 6, 463–477 - PubMed

Publication types

Substances

LinkOut - more resources