

Sphingosine kinase mediates resistance to the synthetic retinoid N-(4-hydroxyphenyl)retinamide in human ovarian cancer cells
- PMID: 20404323
- PMCID: PMC2881785
- DOI: 10.1074/jbc.M109.072801
Sphingosine kinase mediates resistance to the synthetic retinoid N-(4-hydroxyphenyl)retinamide in human ovarian cancer cells
Abstract
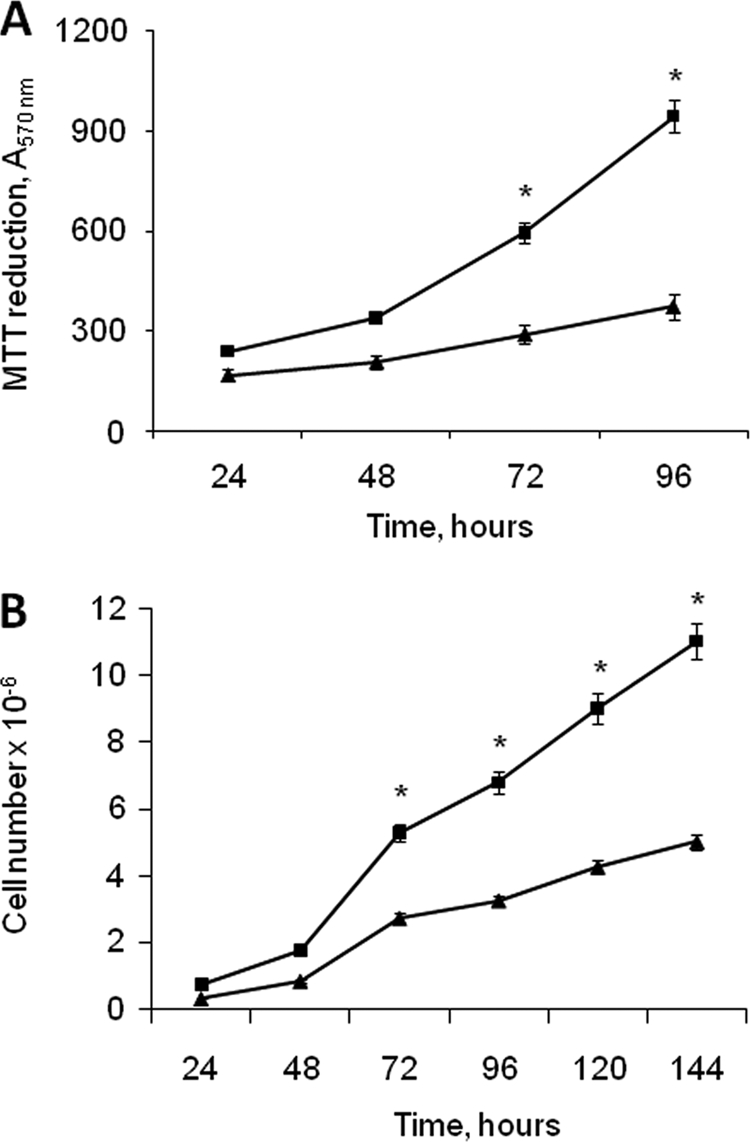
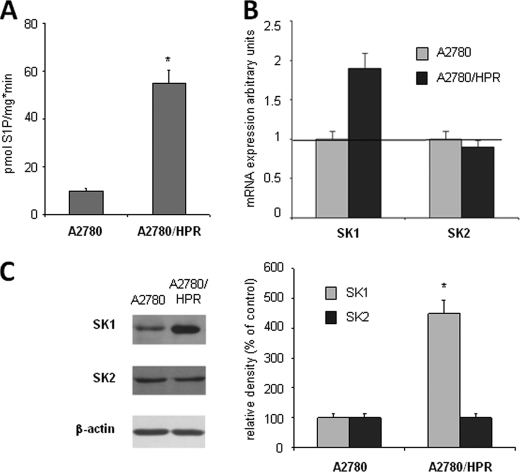
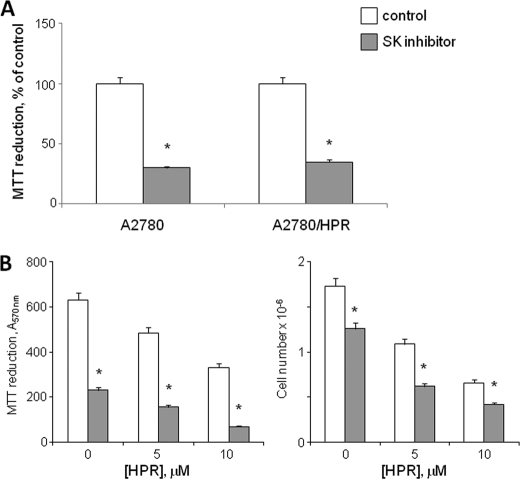
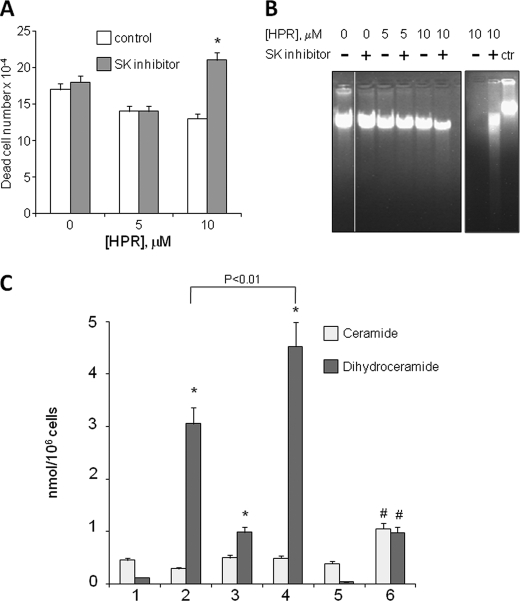
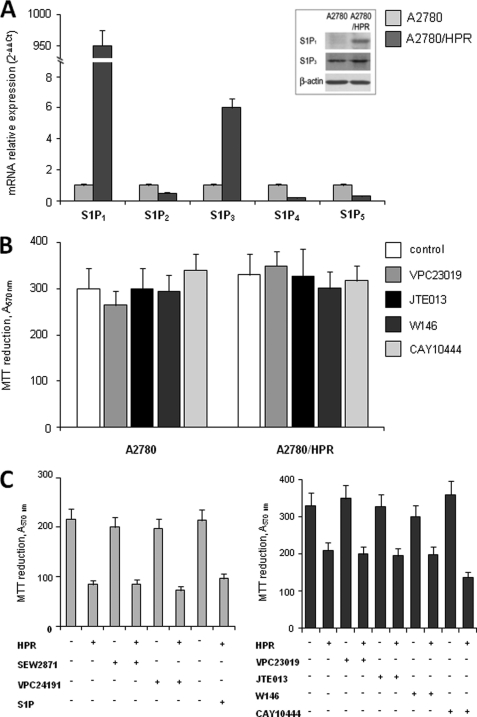
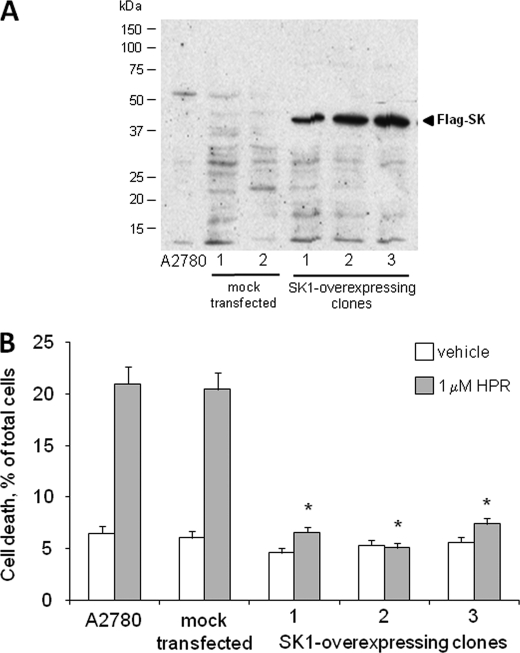
A2780 human ovarian carcinoma cells respond to treatment with the synthetic retinoid N-(4-hydroxyphenyl)retinamide (HPR) with the production of dihydroceramide and with a concomitant reduction of cell proliferation and induction of apoptosis. The derived HPR-resistant clonal cell line, A2780/HPR, is less responsive to HPR in terms of dihydroceramide generation. In this report, we show that the production of sphingosine 1-phosphate (S1P) is significantly higher in A2780/HPR versus A2780 cells due to an increased sphingosine kinase (SK) activity and SK-1 mRNA and protein levels. Treatment of A2780 and A2780/HPR cells with a potent and highly selective pharmacological SK inhibitor effectively reduced S1P production and resulted in a marked reduction of cell proliferation. Moreover, A2780/HPR cells treated with a SK inhibitor were sensitized to the cytotoxic effect of HPR, due to an increased dihydroceramide production. On the other hand, the ectopic expression of SK-1 in A2780 cells was sufficient to induce HPR resistance in these cells. Challenge of A2780 and A2780/HPR cells with agonists and antagonists of S1P receptors had no effects on their sensitivity to the drug, suggesting that the role of SK in HPR resistance in these cells is not mediated by the S1P receptors. These data clearly demonstrate a role for SK in determining resistance to HPR in ovarian carcinoma cells, due to its effect in the regulation of intracellular ceramide/S1P ratio, which is critical in the control of cell death and proliferation.
Figures
Similar articles
-
Decrease in drug accumulation and in tumour aggressiveness marker expression in a fenretinide-induced resistant ovarian tumour cell line.Br J Cancer. 2001 Jun 1;84(11):1528-34. doi: 10.1054/bjoc.2001.1826. Br J Cancer. 2001. PMID: 11384104 Free PMC article.
-
Identification of the fenretinide metabolite 4-oxo-fenretinide present in human plasma and formed in human ovarian carcinoma cells through induction of cytochrome P450 26A1.Clin Cancer Res. 2004 Sep 15;10(18 Pt 1):6265-75. doi: 10.1158/1078-0432.CCR-04-0655. Clin Cancer Res. 2004. PMID: 15448016 Clinical Trial.
-
Altered sphingolipid metabolism in N-(4-hydroxyphenyl)-retinamide-resistant A2780 human ovarian carcinoma cells.J Biol Chem. 2003 Feb 21;278(8):5574-83. doi: 10.1074/jbc.M207269200. Epub 2002 Dec 16. J Biol Chem. 2003. PMID: 12486134
-
4-oxo-fenretinide, a recently identified fenretinide metabolite, induces marked G2-M cell cycle arrest and apoptosis in fenretinide-sensitive and fenretinide-resistant cell lines.Cancer Res. 2006 Mar 15;66(6):3238-47. doi: 10.1158/0008-5472.CAN-05-3362. Cancer Res. 2006. PMID: 16540676
-
Sphingolipidomics of A2780 human ovarian carcinoma cells treated with synthetic retinoids.J Lipid Res. 2010 Jul;51(7):1832-40. doi: 10.1194/jlr.M004010. Epub 2010 Mar 1. J Lipid Res. 2010. PMID: 20194109 Free PMC article.
Cited by
-
Sphingosine kinase 1 as an anticancer therapeutic target.Drug Des Devel Ther. 2015 Jun 23;9:3239-45. doi: 10.2147/DDDT.S83288. eCollection 2015. Drug Des Devel Ther. 2015. PMID: 26150697 Free PMC article. Review.
-
The role of dihydrosphingolipids in disease.Cell Mol Life Sci. 2019 Mar;76(6):1107-1134. doi: 10.1007/s00018-018-2984-8. Epub 2018 Dec 6. Cell Mol Life Sci. 2019. PMID: 30523364 Free PMC article. Review.
-
Natural Products and Small Molecules Targeting Cellular Ceramide Metabolism to Enhance Apoptosis in Cancer Cells.Cancers (Basel). 2023 Sep 20;15(18):4645. doi: 10.3390/cancers15184645. Cancers (Basel). 2023. PMID: 37760612 Free PMC article. Review.
-
Aberrant lipid metabolism: an emerging diagnostic and therapeutic target in ovarian cancer.Int J Mol Sci. 2013 Apr 10;14(4):7742-56. doi: 10.3390/ijms14047742. Int J Mol Sci. 2013. PMID: 23574936 Free PMC article.
-
Sphingosine-1-phosphate receptor-3 signaling up-regulates epidermal growth factor receptor and enhances epidermal growth factor receptor-mediated carcinogenic activities in cultured lung adenocarcinoma cells.Int J Oncol. 2012 May;40(5):1619-26. doi: 10.3892/ijo.2012.1379. Epub 2012 Feb 16. Int J Oncol. 2012. PMID: 22344462 Free PMC article.
References
-
- Kolesnick R., Golde D. W. (1994) Cell 77, 325–328 - PubMed
-
- Liu Y. Y., Han T. Y., Giuliano A. E., Cabot M. C. (2001) FASEB J. 15, 719–730 - PubMed
-
- Liu Y. Y., Han T. Y., Giuliano A. E., Cabot M. C. (1999) J. Biol. Chem. 274, 1140–1146 - PubMed
-
- Gouazé V., Yu J. Y., Bleicher R. J., Han T. Y., Liu Y. Y., Wang H., Gottesman M. M., Bitterman A., Giuliano A. E., Cabot M. C. (2004) Mol. Cancer Ther. 3, 633–639 - PubMed
-
- Liu Y. Y., Han T. Y., Yu J. Y., Bitterman A., Le A., Giuliano A. E., Cabot M. C. (2004) J. Lipid Res. 45, 933–940 - PubMed
Publication types
MeSH terms
Substances
LinkOut - more resources
Full Text Sources
Medical
