. 2010 Jun;20(6):631-46.
doi: 10.1038/cr.2010.55. Epub 2010 Apr 20.

Requirement for cyclin D3 in germinal center formation and function

Affiliations

Requirement for cyclin D3 in germinal center formation and function

Jonathan U Peled et al. Cell Res. 2010 Jun.

Abstract

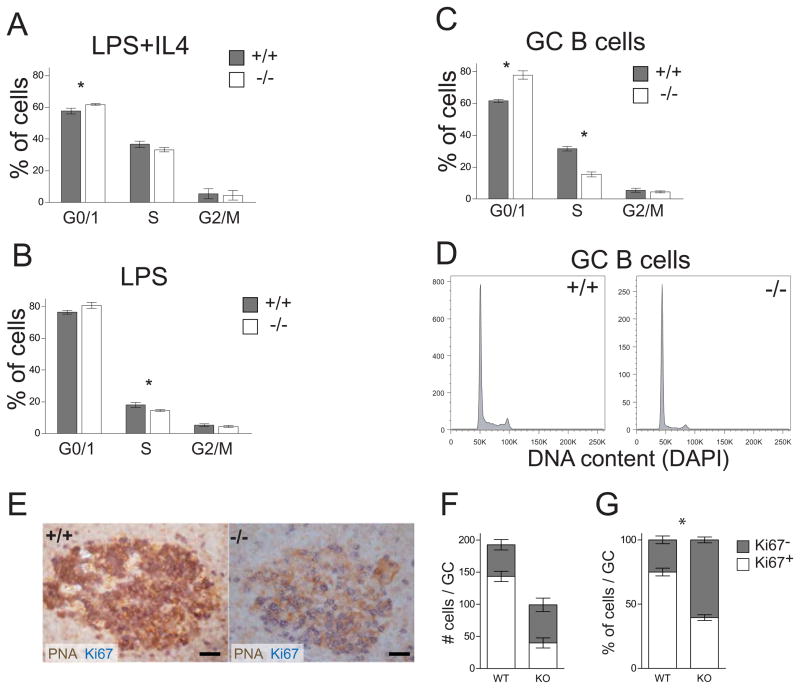
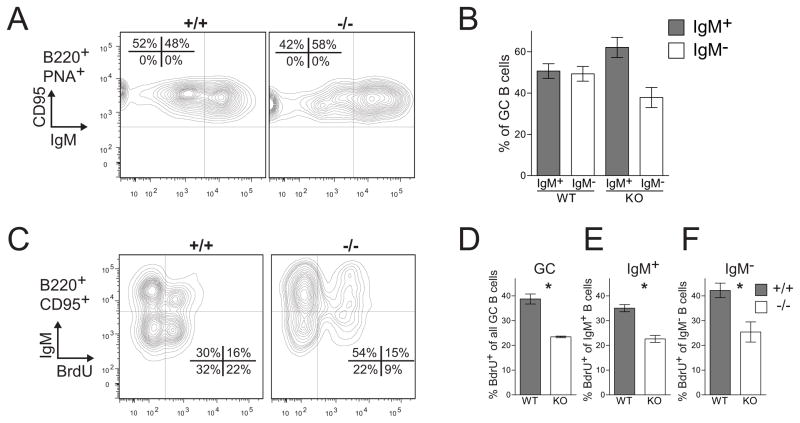
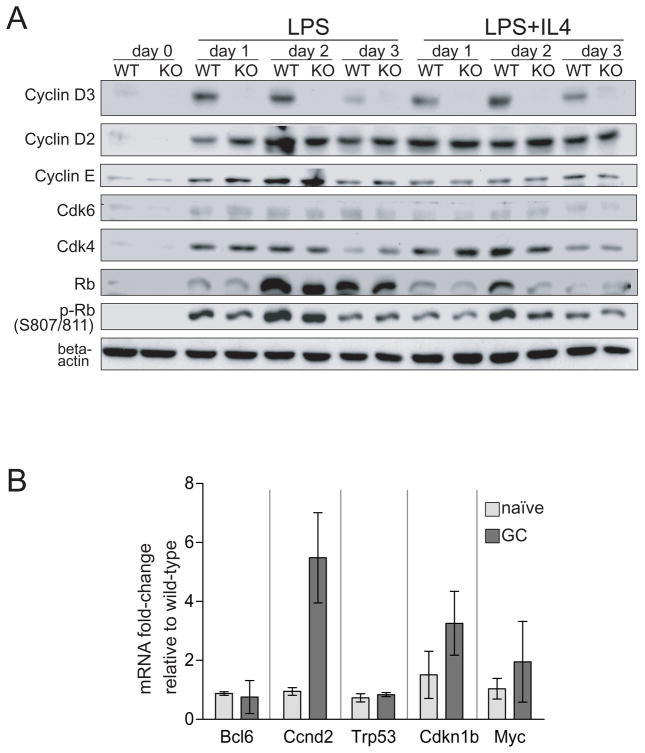
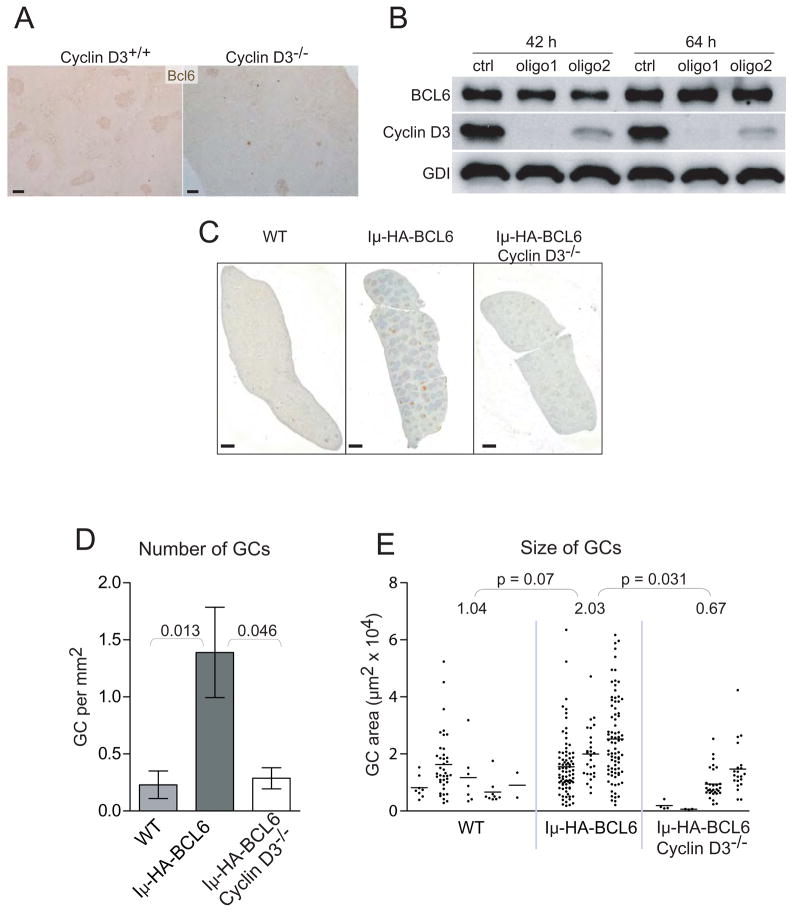
Germinal centers (GC) of secondary lymphoid tissues are critical to mounting a high-affinity humoral immune response. B cells within the GC undergo rapid clonal expansion and selection while diversifying their antibody genes. Although it is generally believed that GC B cells employ a unique proliferative program to accommodate these processes, little is known about how the GC-associated cell cycle is orchestrated. The D-type cyclins constitute an important component of the cell cycle engine that enables the cells to respond to physiological changes. Cell type- and developmental stage-specific roles of D-type cyclins have been described but the cyclin D requirement during GC reaction has not been addressed. In this study, we report that cyclin D3 is largely dispensable for proliferation and Ig class switching of in vitro activated B cells. In contrast, GC development in Ccnd3(-/-) mice is markedly impaired, as is the T cell-dependent antibody response. Within the GC, although both switched and unswitched B cells are affected by cyclin D3 inactivation, the IgM(-) pool is more severely reduced. Interestingly, despite a compensatory increase in cyclin D2 expression, a significant number of Ccnd3(-/-) GC B cells accumulate in quiescent G0 state. Lastly, although cyclin D3 inactivation did not disrupt BCL6 expression in GC B cells, it completely blocked the GC promoting effect of BCL6 overexpression, suggesting that cyclin D3 acts downstream of BCL6 to regulate GC formation. This is the first demonstration that cyclin D3 plays an important and unique role at the GC stage of B cell development.


Figures

Figure 1
Figure 1
Cyclin D3 is expressed in B220+PNA+ GC B cells and predominantly in the dark zone. (A–E) Spleen sections collected 14 days after immunization of WT mice were stained with antibodies for either cyclin D3 (blue) alone (in A) or in combination with other stains in brown: (B) CD21/CD35; (C) B220; (D) PNA; E, CD3. Arrows in (A) GCs that were positively stained for cyclin D3. Arrowhead in (A) Cyclin D3+ cells in red pulp. Arrows in (C–E) indicate that cyclin D3+ cells are B220+ (in C), PNA+ (in D), and that CD3+ cells lack detectable Cyclin D3 stain (in E). Human tonsil sections were stained in panels (F–J). (F) Cyclin D3 stain is enriched in one part of a GC (arrow) compared to another (arrowhead). (G) Adjacent section stained for Cyclin D3 (blue) and CD79a (brown) to identify B cells within the GC as well as the follicular mantle (asterisk). Note that the mantle zone B cells are uniformly negative for Cyclin D3. (H) Magnified view of the boxed region in (G) illustrates CD79a+Cyclin D3+ GC B cells (arrowheads). Note a CD79a+Cyclin D3 plasma cell (arrow). (I) Adjacent section stained for Cyclin D3 (blue) and CD3 (brown) to corroborate the designation of light and dark zone. (J) Magnified view of the boxed region in (I) shows CD3+Cyclin D3 GC T cells (arrows, examples). Scale bars are 100 μm for (A); 200 μm for (B); 10 μm for (C–E, H, and J); and 200 μm for (F, G, and I).
Figure 2
Figure 2
Splenic B cell subsets in WT and cyclin D3 KO mice. (A) Mature and transitional B cell subsets were identified as B220+AA4.1 and B220+AA4.1+ respectively. (B) The transitional B cell gate was used to identify T1 (CD21HSAhi) and T2 (CD21hiHSAhi) subsets. A significant decrease in immature B cells and an increase in mature B cells were observed in cyclin Ccnd3−/−mice compared to WT controls. The transitional T1 and T2 subsets remained unchanged in these mice. (C) The mature B cell gate was used to identify marginal zone (CD21hiCD23) and follicular (CD21intCD23+) B cell subsets. The Ccnd3−/− mice also displayed a two-fold increase in MZ B cells and a reduction in Fo B cells. Four WT and five Ccnd3−/− mice were analyzed. Representative dot plots are shown. Columns in the graphs represent mean and SEM of each genotype. P values of 2-tailed Student t tests are also shown in the graphs.
Figure 3
Figure 3
GC size and frequency are reduced in Ccnd3−/− mice. Representative images of spleen sections from WT littermate (A) and Ccnd3−/− mice (B) stained for the GC marker PNA (brown) 14 d after immunization with SRBC. Scale bars are 0.5 mm; arrow, a PNA-stained GC. (C) Flow-cytometric enumeration of B220+PNAhiCD95hi splenocytes (top) and LN cells (bottom). Spleen and LN data are representative of 12 and 2 animals, respectively, for each genotype. (D) Loss of cyclin D3 caused a ~3-fold decrease in GC frequency. Five WT and seven cyclin D3-deficient mice were analyzed, p <0.0001, error bars are SEM. (E) Loss of cyclin D3 caused a ~2-fold decrease in GC size. Each column in the graph corresponds to an individual mouse; each point is an individual GC, p < 0.01. P values are based on 2-tailed Student t tests.
Figure 4
Figure 4
T-cell dependent antibody response is defective in the absence of cyclin D3. Column scatter plots display ELISA data for KO (white) and WT controls (black) mice. Each point is an individual animal. Statistical analysis is detailed in the Materials and Methods section. Significant p values (<0.05) are emboldened and underlined. (A) Resting Ig levels. (B) NP-specific antibodies 13 d after primary immunization. ELISA plate coat was NP20-BSA. NP-specific titers for each subclass are given in arbitrary units. (C–D) NP-specific IgG1 levels. Serum samples were collected 13 days after the primary immunization (“primary”) and five days after each boost (“secondary” and “tertiary”, see Supplemental Figure 2 for experimental scheme). In (C) the plate coat was NP30-BSA, which binds low- and high-affinity antibodies. In (D) the plate coat was NP3-BSA, which binds only high-affinity antibodies. In E, the ratio of NP3 to NP30 binding is plotted as an index of affinity maturation. Error bars are SEM.
Figure 5
Figure 5
GC B cells in vivo, but not in vitro-activated mature B cells, require cyclin D3 for proliferation. (A–B) PI staining was used to examine cell cycle profiles of primary splenic B cells stimulated for 3 d as indicated. n = 4, asterisk indicates p<0.05. (C–D) DAPI-based cell cycle profiles of B220+PNAhi GC B cells 11 d after SRBC immunization. (C) Mean and SEM of 4 KO (white bars) and 3 WT controls mice (grey bars). (D) Representative cell cycle profiles of KO and WT GC B cells. (E) Spleens prepared as in Figure 1 were stained with PNA (brown) and Ki67 (blue). Many Ccnd3−/− PNA+ GC cells do not express Ki67. Scale bars are 30 μm. (F) Individual PNA+ cells from 10 Ccnd3−/− and 6 WT GCs were manually scored as Ki67+ (white bar) or Ki67 (dark bar). (G) Normalization of data from panel (F) demonstrates that 75% of PNA+ GC B cells in WT mice were Ki67+, compared to only 40% in Ccnd3−/− mice (p < 0.0001). All error bars are SEM.
Figure 6
Figure 6
Cyclin D3 is required for expansion of both IgM+ and IgM compartments within the GC. Splenocytes, isolated from mice that were SRBC-immunized 14 days previously and exposed to BrdU for 6 hr before sacrifice, were analyzed by flow cytometry. (A) Representative profile of splenic B220+PNA+CD95hi GC cells assayed for expression of IgM. (B) Averaged results from (A) showing WT GCs contained comparable numbers of IgM+ and IgM cells, while Ccnd3−/− GCs had more IgM+ than IgM cells (58% vs 42%, n = 2 WT and 3 KO, p = 0.068). (C) B220+CD95hi GC cells from Ccnd3−/− and WT mice were analyzed for the expression of IgM and incorporation of BrdU (n = 2 WT and 2 KO). (D) Among all GC B cells, 39% incorporated BrdU in the WT mice compared to 23% in Ccnd3−/− animals (p = 0.009). Comparable reductions in BrdU uptake were observed in the IgM+ (E, p = 0.013) and IgM (F, p = 0.042) compartments. All error bars are SEM.
Figure 7
Figure 7
Effect of cyclin D3 inactivation on expression of selected G1 regulators in LPS-stimulated B cells and GC B cells. (A) Splenic B cells were stimulated as indicated, and whole cell lysates were used in Western Blot analysis of selected G1 phase regulators. Beta-actin was used as a loading control. (B) qRT-PCR analysis of mRNA expression in flow-sorted naïve (B220+PNAlo) and GC (B220+PNAhi) B cells. The ΔΔCT method was used to calculate the fold-change in cyclin D3 KO cells relative to WT control levels. Means and SD based on 2–4 animals per genotype are plotted.
Figure 8
Figure 8
Cyclin D3 works downstream of Bcl6 in GC development. (A) Cross-sections of mouse spleens 14 d after SRBC immunization were stained with antibodies against Bcl6. Scale bars are 100 μm. (B) The GCB-like DLBCL cell line SuDHL6 was treated with either a control (ctrl) or two different Cyclin D3 siRNA oligos (#1 and #2). At the indicated times after transfection, expression of the endogenous BCL6 and Cyclin D3 proteins were analyzed by Western Blotting. GDI was used as a loading control. Similar results were obtained from two other GCB-like DLBCL lines Ly7 and Val (not shown). (C–E) The Ccnd3−/− mice were bred to mice carrying the Iμ-HA-BCL6 knock-in allele. Spontaneous GC formation in spleens of unimmunized mice was examined by PNA staining and quantified as in Figure 3. (C) Representative PNA-stained spleen sections from each indicated genotype are shown. Scale bars are 1 mm. (D) The frequency of GC initiation is plotted as the number of GCs per mm2. Error bars are SEM. (E) The column scattered plot shows the size of GCs in each animal. Each column corresponds to an individual mouse; each point is an individual GC. All significant P values based on 2-tailed Student t tests are shown above the graphs. There was no significant difference between the WT and the Iμ-HA-BCL6 Ccnd3−/− groups either in GC number or size.

Similar articles

Cited by

References

    1. Stavnezer J, Guikema JE, Schrader CE. Mechanism and Regulation of Class Switch Recombination. Annu Rev Immunol. 2008;26:261–292. - PMC - PubMed
    1. Peled JU, Kuang FL, Iglesias-Ussel MD, et al. The biochemistry of somatic hypermutation. Annu Rev Immunol. 2008;26:481–511. - PubMed
    1. Wang Y, Carter RH. CD19 regulates B cell maturation, proliferation, and positive selection in the FDC zone of murine splenic germinal centers. Immunity. 2005;22 (6):749–761. - PubMed
    1. Allen CD, Okada T, Cyster JG. Germinal-center organization and cellular dynamics. Immunity. 2007;27 (2):190–202. - PMC - PubMed
    1. Klein U, Dalla-Favera R. Germinal centres: role in B-cell physiology and malignancy. Nat Rev Immunol. 2008;8 (1):22–33. - PubMed

Publication types

MeSH terms