. 2010 Apr 9;5(4):e10101.
doi: 10.1371/journal.pone.0010101.

Biological markers of auditory gap detection in young, middle-aged, and older adults

Affiliations

Biological markers of auditory gap detection in young, middle-aged, and older adults

Bernhard Ross et al. PLoS One. .

Abstract

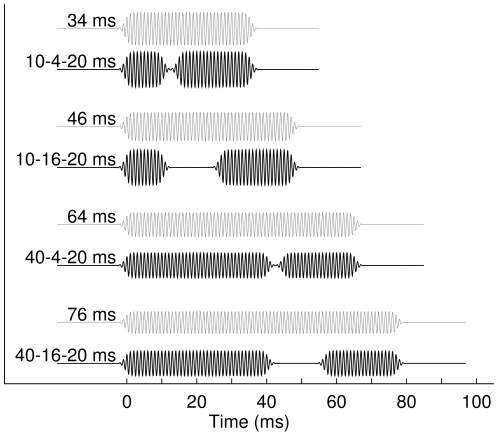
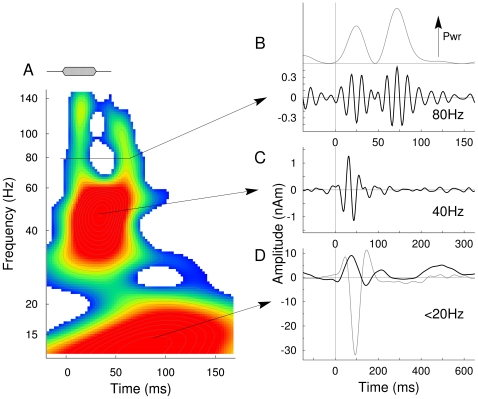
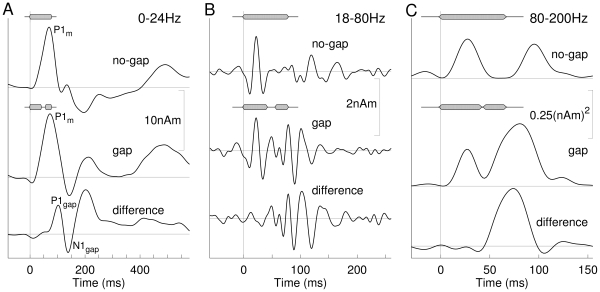
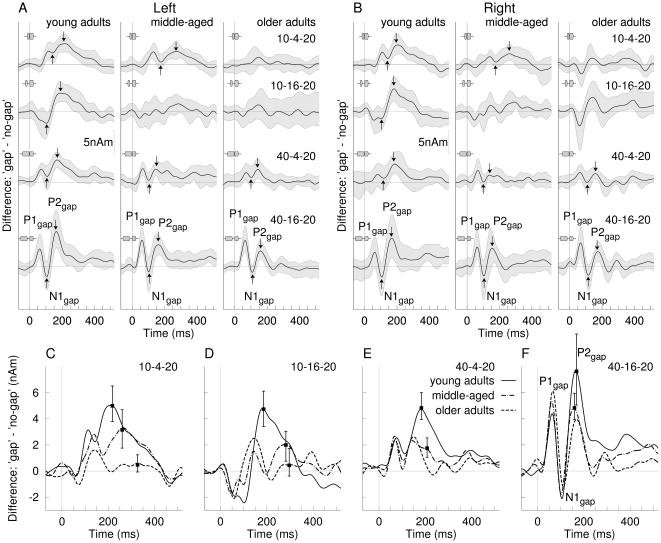
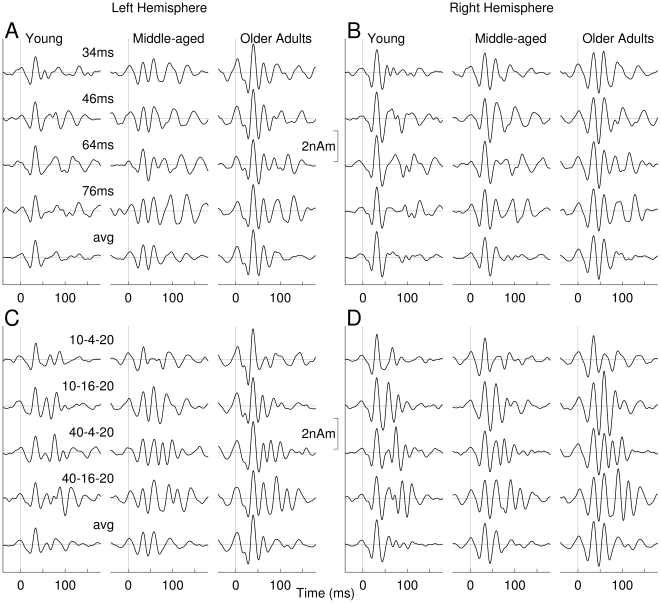
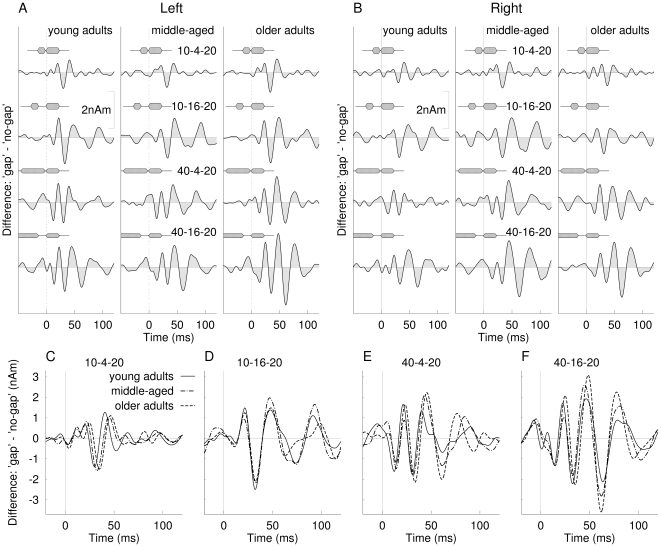
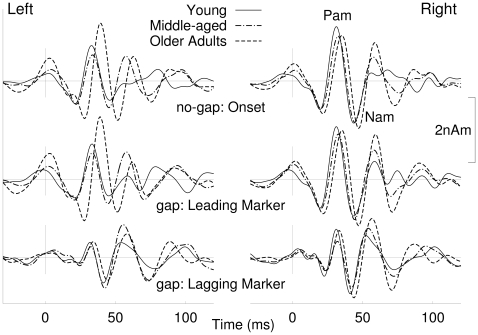
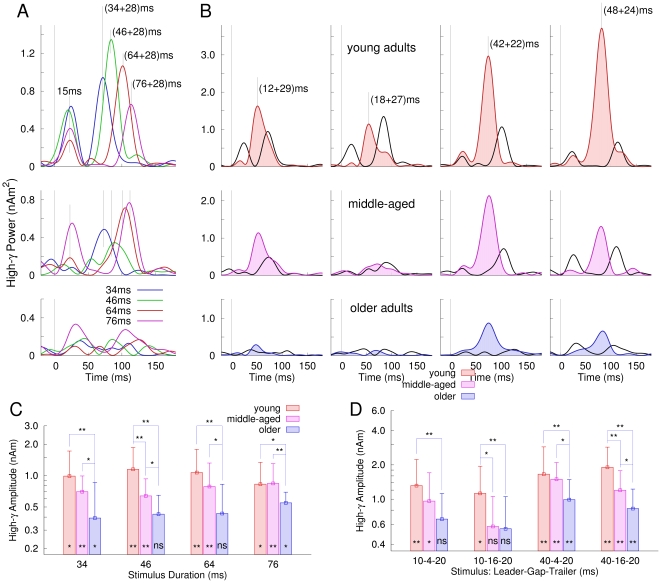
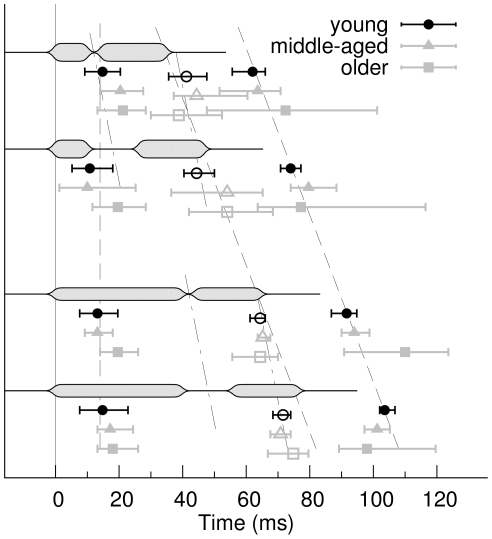
The capability of processing rapid fluctuations in the temporal envelope of sound declines with age and this contributes to older adults' difficulties in understanding speech. Although, changes in central auditory processing during aging have been proposed as cause for communication deficits, an open question remains which stage of processing is mostly affected by age related changes. We investigated auditory temporal resolution in young, middle-aged, and older listeners with neuromagnetic evoked responses to gap stimuli with different leading marker and gap durations. Signal components specific for processing the physical details of sound stimuli as well as the auditory objects as a whole were derived from the evoked activity and served as biological markers for temporal processing at different cortical levels. Early oscillatory 40-Hz responses were elicited by the onsets of leading and lagging markers and indicated central registration of the gap with similar amplitude in all three age groups. High-gamma responses were predominantly related to the duration of no-gap stimuli or to the duration of gaps when present, and decreased in amplitude and phase locking with increasing age. Correspondingly, low-frequency activity around 200 ms and later was reduced in middle aged and older participants. High-gamma band, and long-latency low-frequency responses were interpreted as reflecting higher order processes related to the grouping of sound items into auditory objects and updating of memory for these objects. The observed effects indicate that age-related changes in auditory acuity have more to do with higher-order brain functions than previously thought.


Conflict of interest statement

Competing Interests: The authors have declared that no competing interests exist.

Figures

Figure 1
Figure 1. Waveforms of the auditory stimuli.
The sounds of 34, 46, 64, and 76 ms total duration, respectively, were either continuous tones or contained a temporal gap. The gap lengths were 4 or 16 ms, the length of the leading marker 10 or 40 ms, and the trailing marker was always 20 ms long. The stimulus amplitudes were adjusted for equal energy.
Figure 2
Figure 2. Overview of the types of auditory evoked responses.
A: The time-frequency map of inter-trial coherence in the responses to the 34-ms no-gap stimulus shows three main effects: the low frequency response below 20 Hz, the transient gamma band response at 40 Hz, and high-gamma responses at 80 Hz and above. B: The time series of activity in the high-gamma band shows two bursts of oscillations, which are expressed in two peaks in the time series of the signal power (upper trace). C: The transient 40-Hz response is likely equivalent to the middle-latency response. D: The low frequency response (black) shows predominantly a positive peak resembling a P1m response. The N1m -P2m response is strongly reduced because of fast stimulus repetition. For comparison the response to same stimuli at longer SOA (1500ms) is shown as gray line.
Figure 3
Figure 3. Comparison of responses to no-gap and gap stimuli using difference waveforms.
As an example, the responses to the stimulus with long leading marker and long gap (40-16-20 ms) are shown as grand average for the young group. A: Waveforms of the 0–24 Hz low-pass filtered responses show similar P1m waves for the gap and no-gap condition. In the difference waveform (lower trace), a clear P1m -N1m -P2m like pattern appears with delayed latency compared to the onset response. B: Waveforms of the 18–80 Hz band-pass filtered responses. The transient onset response is almost identical for the gap and no-gap response and is cancelled out in the difference waveform, which shows a more complex pattern of oscillation than the onset response. C: Signal power of the 80–200 Hz filtered high-gamma band data. Two bursts of high-gamma activity occur for the gap and no-gap stimulus, respectively. The second gamma burst for the gap stimulus is largest and appears earlier than the second burst for the no-gap stimulus. The difference in signal power shows predominantly a single burst of high-gamma activity.
Figure 4
Figure 4. Difference waves between 24-Hz low-pass filtered responses to gap and no-gap stimuli.
A: Comparison of difference waves observed in the left hemisphere between the three age groups. The thick lines represent the group mean difference waves and the gray shaded areas above and below indicate the 95% confidence interval for the group mean. The time scale was adjusted that zero corresponds to the onset of the trailing marker. P1m -N1m -P2m waves can be observed for all age groups in the responses to the 40-16-20 ms stimulus. In general the response size declined with shorter gap duration and shorter duration of the leading marker. Upward arrows point to possible N1gap waves and downward arrows P2gap waves. B: Difference waves in the right hemisphere resembled the left hemispheric responses in wave configuration, amplitudes and latencies. C–F: Overlay of grand mean difference waves across hemispheres for the three age groups and the four stimulus conditions.
Figure 5
Figure 5. Waveforms of transient gamma band responses for the three age groups, eight stimulus types and left and right hemispheres.
(Time zero refers to the stimulus onset.) A: Responses to no-gap stimuli as observed in the left hemisphere. The bottom trace shows the response waveform averaged across the four stimuli with different duration. B: Right hemispheric responses to no-gap stimuli. C–D: Responses to gap-stimuli accordingly.
Figure 6
Figure 6. Difference waves between gap and no-gap stimuli for the transient 40-Hz response, the three age groups, and four different stimuli.
Time zero of all time scales is adjusted to the onset of the trailing marker. A: Difference waves observed in the left and B: in the right hemisphere. C–F: Overlay of difference waves observed in the three age groups averaged across left and right hemispheres.
Figure 7
Figure 7. Overlay of grand averaged responses to the onset of no-gap stimuli for the three age groups (top traces).
The most prominent positive and negative going waves are labeled in the right hemispheric responses as Pam and Nam according to the nomenclature used for middle latency responses. Grand averaged responses to the onset of the leading markers of gap stimuli are shown in the middle traces and responses to the lagging markers obtained from the difference waves in the bottom traces.
Figure 8
Figure 8. Time courses of activity in the higher gamma band (72–98 Hz) in the right auditory cortex.
A: The responses to the no-gap stimuli exhibit two peaks, the first 15 ms after stimulus onset, the second 28 ms after stimulus offset. The response amplitudes decline with increasing age. B: Time courses of high-gamma responses to gap stimuli are shown in different color for the age groups in comparison to responses to the no-gap stimuli shown as black lines. The main peak in the responses to gap stimuli appears at latency between those of the onset and offset response in the corresponding no-gap stimuli. Responses to gap-stimuli were in general larger than responses to no-gap stimuli (note the different scales on the y-axes). C: Bar graphs representing the peak amplitude of the offset response to no-gap stimuli for the three age groups. The error bars denote the upper 95% confidence limits for the group mean. Results of the analysis of phase coherence across each group are indicated at the base of each bar (*: .05≤p<0.01, **: p≤0.01, ns: not significant). D: Bar graphs of the amplitudes of high-gamma responses to gap stimuli.
Figure 9
Figure 9. Group mean latencies of the high-gamma peak.
Gap responses are marked with open symbols, onset and offset responses to the no-gap stimuli with filled symbols. The error bars denote the 95% confidence intervals for the group means. The dashed lines are parallels to the time points of sound onset and sound offset indicating that the latencies of the response to no-gap stimuli are well explained by a constant delay added to onset or offset latency. The dash-dotted lines are parallels to the mid points of the gaps and suggest that the latency of the gap responses (open symbols) are better explained by a constant delay with respect to the gap mid point.

References

    1. Phillips DP. Auditory gap detection, perceptual channels, and temporal resolution in speech perception. J Am Acad Audiol. 1999;10:343–354. - PubMed
    1. Plomp R. Rate of decay of auditory sensation. J Acoust Soc Am. 1964;36:277–282.
    1. Green DM, Forrest TG. Temporal gaps in noise and sinusoids. J Acoust Soc Am. 1989;86:961–970. - PubMed
    1. Shailer MJ, Moore BC. Gap detection as a function of frequency, bandwidth, and level. J Acoust Soc Am. 1983;74:467–473. - PubMed
    1. Eddins AC, Peterson JR. Time-intensity trading in the late auditory evoked potential. J Speech Lang Hear Res. 1999;42:516–525. - PubMed

Publication types