. 2010 Apr 13;5(4):e10153.
doi: 10.1371/journal.pone.0010153.

Uncovering molecular biomarkers that correlate cognitive decline with the changes of hippocampus' gene expression profiles in Alzheimer's disease

Affiliations

Uncovering molecular biomarkers that correlate cognitive decline with the changes of hippocampus' gene expression profiles in Alzheimer's disease

Martín Gómez Ravetti et al. PLoS One. .

Abstract

Background: Alzheimer's disease (AD) is characterized by a neurodegenerative progression that alters cognition. On a phenotypical level, cognition is evaluated by means of the MiniMental State Examination (MMSE) and the post-mortem examination of Neurofibrillary Tangle count (NFT) helps to confirm an AD diagnostic. The MMSE evaluates different aspects of cognition including orientation, short-term memory (retention and recall), attention and language. As there is a normal cognitive decline with aging, and death is the final state on which NFT can be counted, the identification of brain gene expression biomarkers from these phenotypical measures has been elusive.

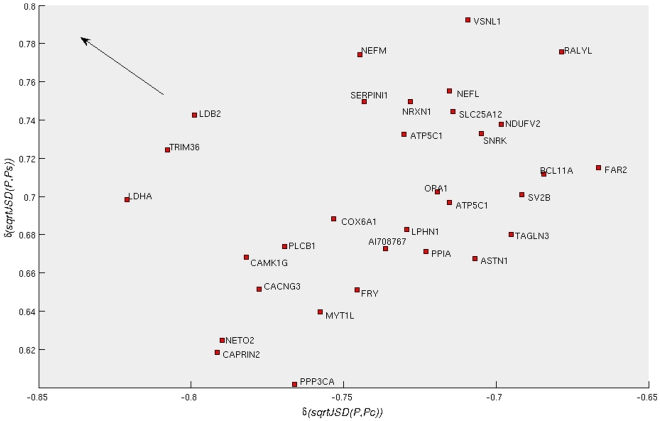
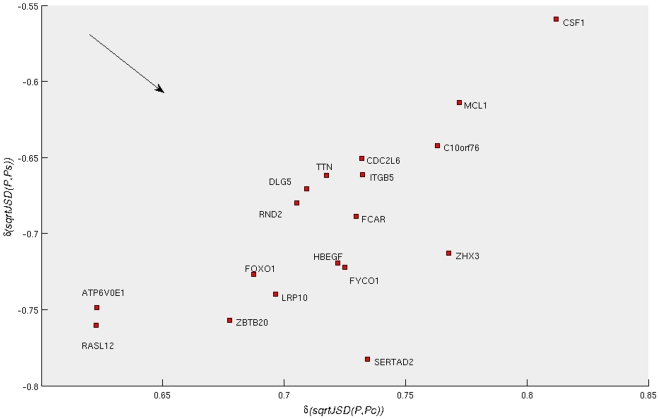
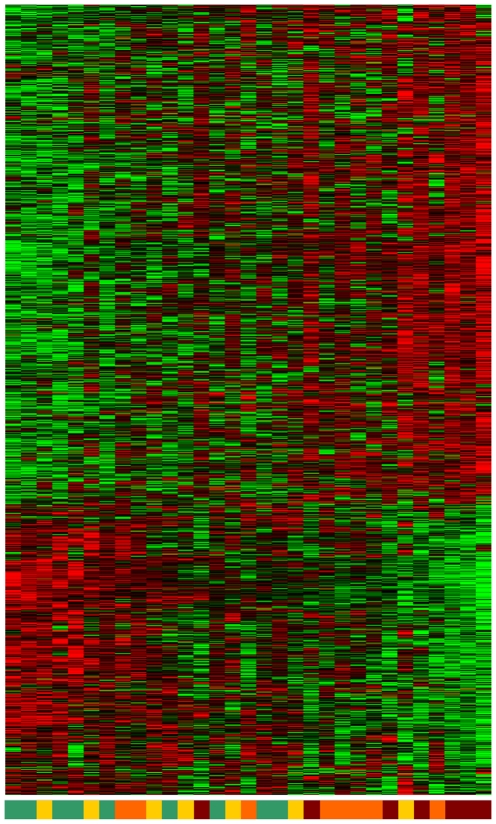
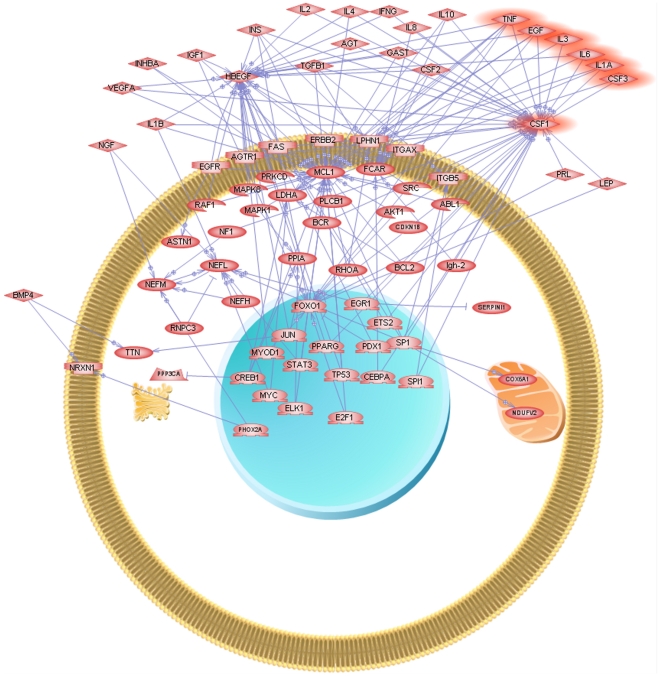
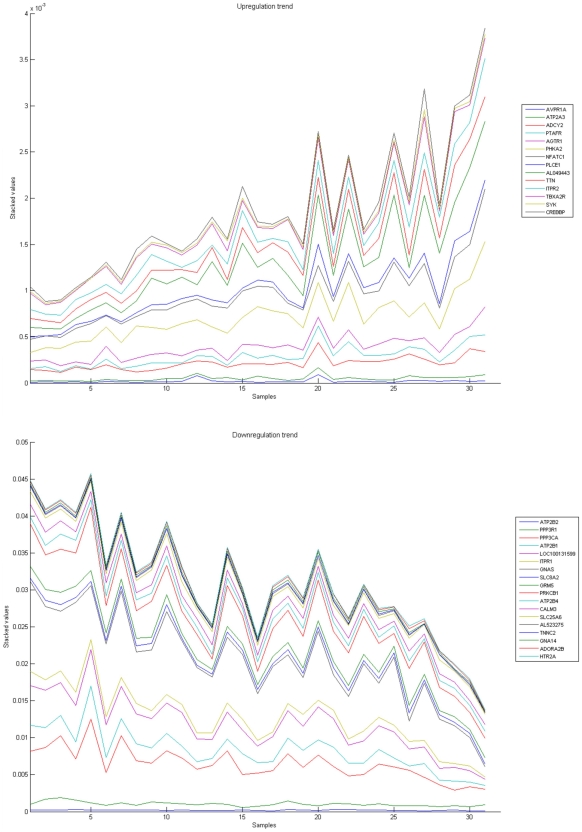
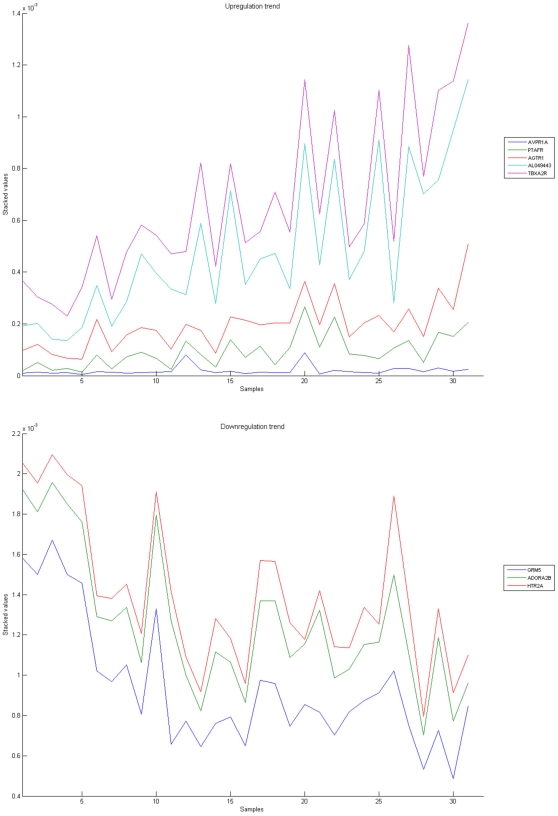
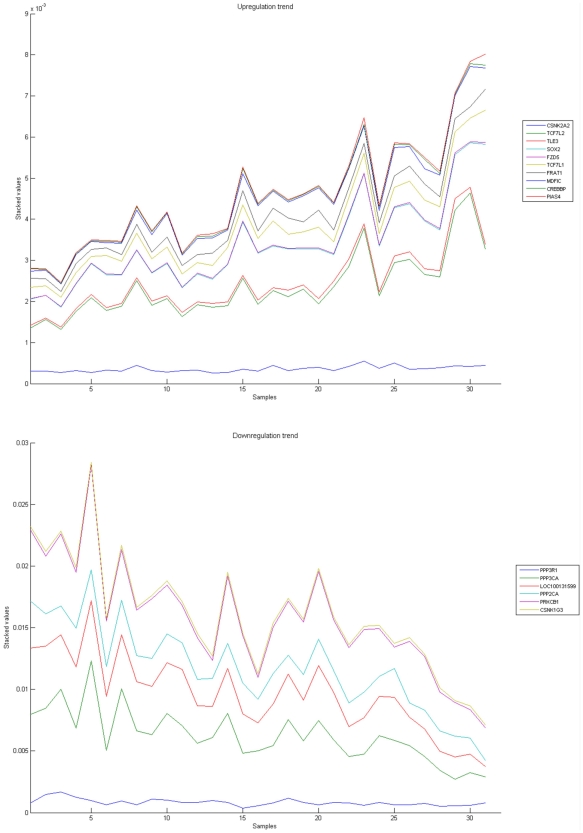
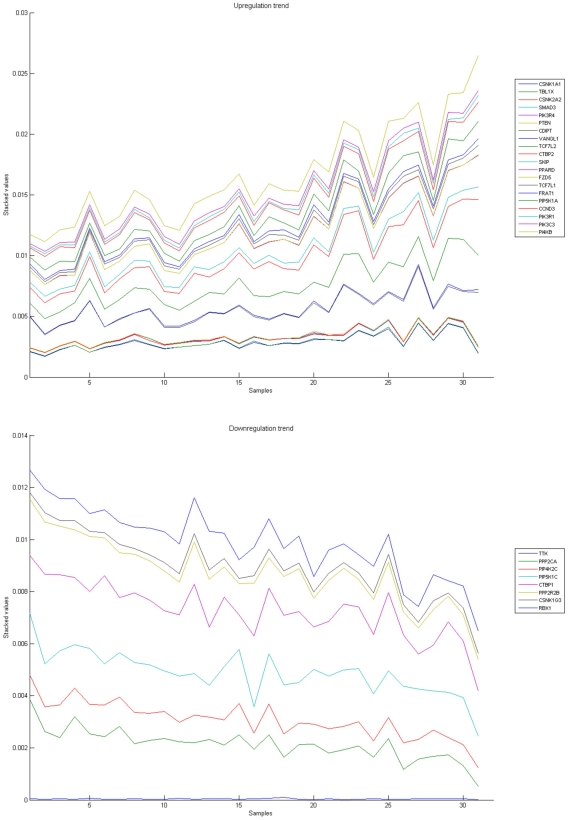
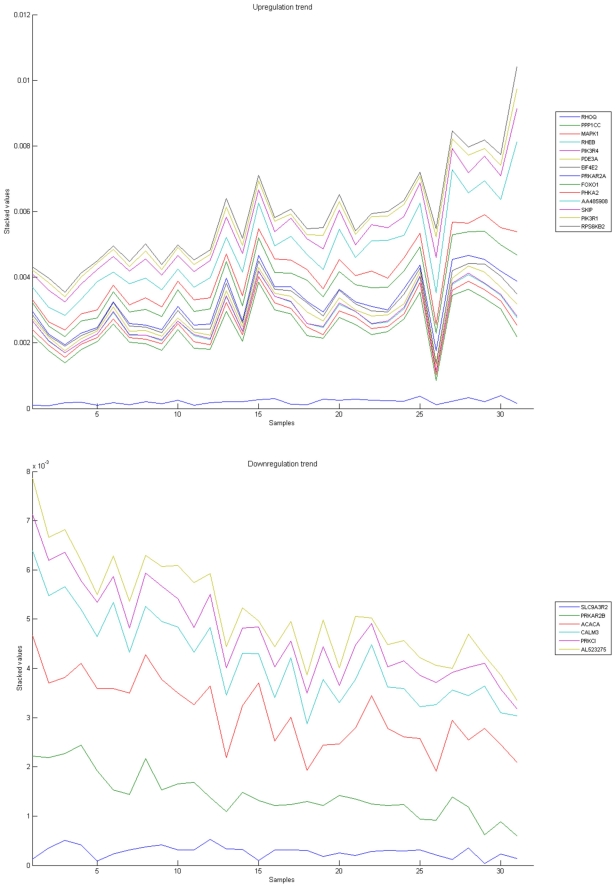
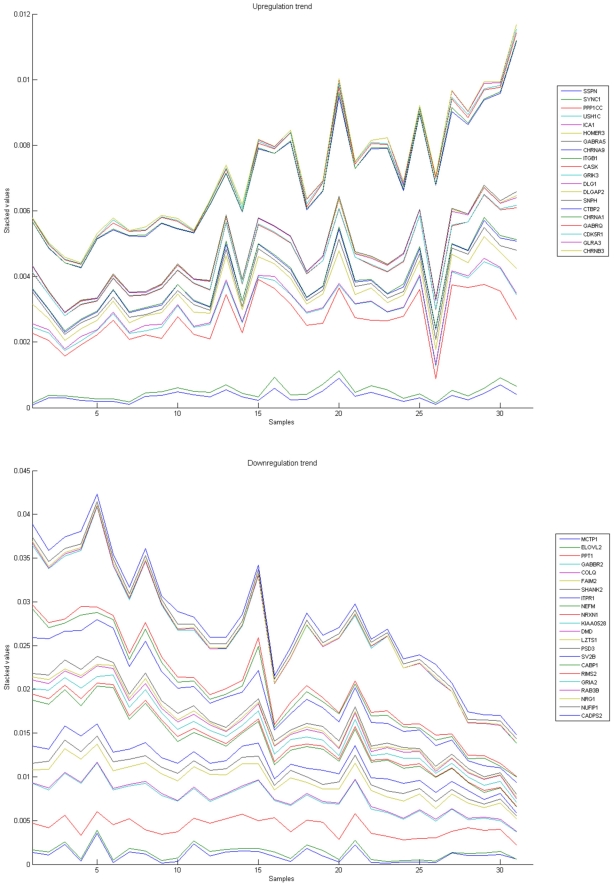
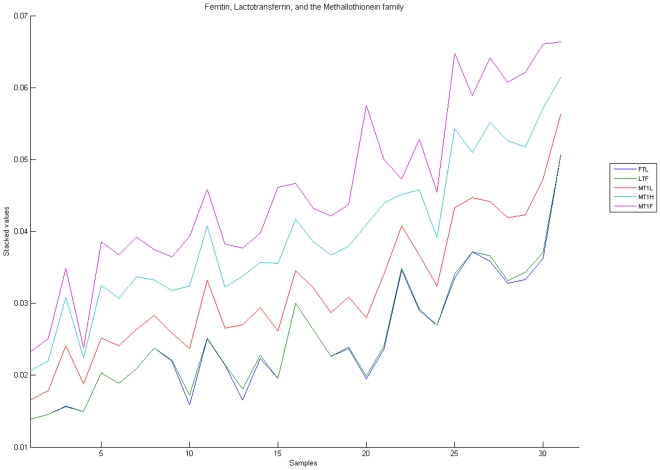
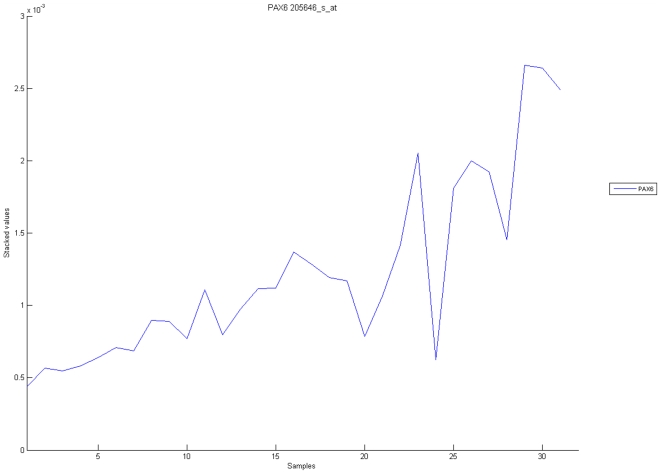
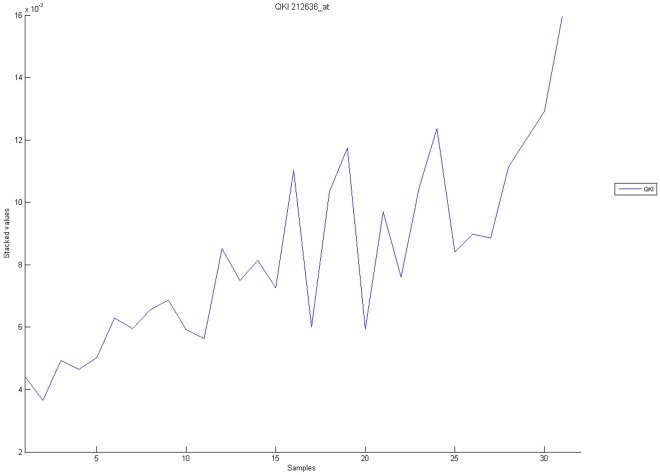
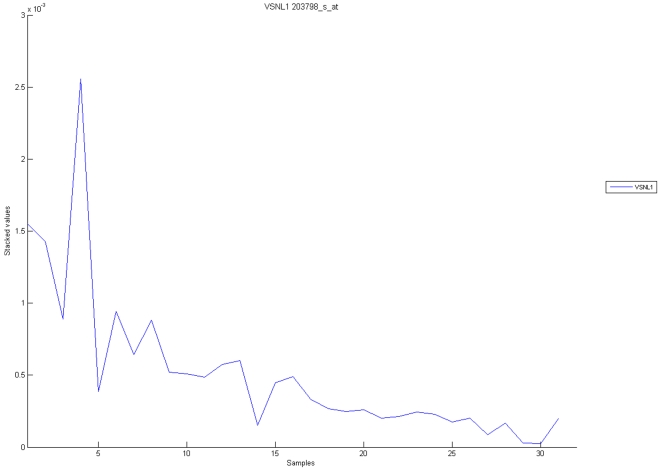
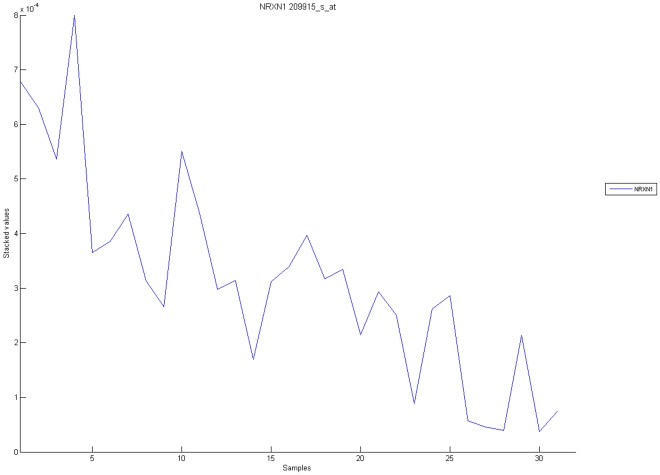
Methodology/principal findings: We have reanalysed a microarray dataset contributed in 2004 by Blalock et al. of 31 samples corresponding to hippocampus gene expression from 22 AD subjects of varying degree of severity and 9 controls. Instead of only relying on correlations of gene expression with the associated MMSE and NFT measures, and by using modern bioinformatics methods based on information theory and combinatorial optimization, we uncovered a 1,372-probe gene expression signature that presents a high-consensus with established markers of progression in AD. The signature reveals alterations in calcium, insulin, phosphatidylinositol and wnt-signalling. Among the most correlated gene probes with AD severity we found those linked to synaptic function, neurofilament bundle assembly and neuronal plasticity.

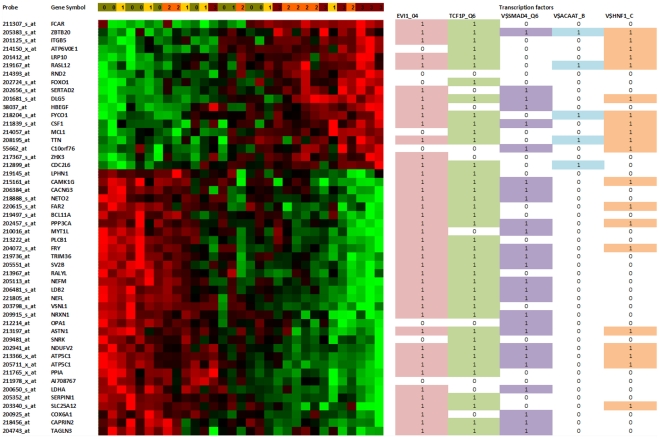
Conclusions/significance: A transcription factors analysis of 1,372-probe signature reveals significant associations with the EGR/KROX family of proteins, MAZ, and E2F1. The gene homologous of EGR1, zif268, Egr-1 or Zenk, together with other members of the EGR family, are consolidating a key role in the neuronal plasticity in the brain. These results indicate a degree of commonality between putative genes involved in AD and prion-induced neurodegenerative processes that warrants further investigation.


Conflict of interest statement

Competing Interests: The authors have declared that no competing interests exist.

Figures

Figure 1
Figure 1. This plot illustrates that the third step of our methodology, the use of the Jensen-Shannon divergence, does not appear to give an interesting separation of the samples in the absence of a previous feature selection step.
For this graph, all 22,215 genes were considered in the calculation of the average profile of the samples in the “Control” and “Severe AD” classes. The square root of the Jensen-Shannon divergences to the “Control” and “Severe AD” average profile are computed, respectively giving, for each sample, its x and y coordinates in this plot. Observe that most of the “Control” samples have values lower than 0.12, with two exceptions. This result is expected, as the probability distribution function of the “Control” class was used. However, most of the samples from AD patients (having either “Incipient AD”, “Moderate” or “Severe” labels), show a divergence with the Control average gene expression profile. Figure 2 shows the important contribution provided by the feature selection step.
Figure 2
Figure 2. This plot illustrates that after application of the feature selection steps, followed by the computation of the gene expression profile's average profile of the samples in the “Control” and “Severe AD” classes (now on a set of 1,372 probes), the samples are now more clearly separated.
Here, all “Control” samples have the square root of the Jensen-Shannon divergences to the average gene expression of the “Control” samples (x-coordinate) smaller than 0.12 (almost all severe AD have x-coordinates greater than 0.15). In addition to that, most samples labelled “Severe AD” are located on the same region. Both results are expected. However, it is interesting that in this (x,y)-plot most samples that are labelled “Incipient AD” or “Moderate AD” seem to “bridge” between the regions that have most of the “Control” samples and the region that have most of the “Severe AD” group. This result is interesting as no samples from “Incipient AD” nor “Moderate AD” have been used in the first three steps of our methodology. In essence, the work is a “test set” indicating that it is reasonable to expect that some genes in the genetic signature of 1,372 probes have information about a putative “progression” trend of the disease, from the “Control” to the “Severe AD” profile. In what follows, correlations across all the samples with these divergences are used as a method to try to identify those gene profiles that are most correlated with the progression from “Control” to “Severe AD”.
Figure 3
Figure 3. This plot shows the MMSE scores as a function of the square root of the Jensen-Shannon divergences to the average gene expression of the “Control” samples.
‘Incipient AD’ samples, although having a lower value for their MMSE score, still do not show a dramatic change in their x-coordinates compared to the ‘Control’ samples. ‘Moderate AD’ samples appear to be more scattered, with some of them already having a significant divergence from the ‘Control’ average profile.
Figure 4
Figure 4. Correlation of the expression profiles of 1,372 probes (across samples) with the sqrtJSD of the samples of two reference groups (“Control” and “Severe AD”, represented by the average expression profile in the group).
The 50 probes in red are those most distant from the origin of this system of coordinates. Those probes have expression-value variations that are correlated with the divergences of the average “Control” profile and at the same time with the “Severe AD”.
Figure 5
Figure 5. Zoom of Figure 4, identifying the most distant probes from the origin with negative correlation with the control profile, and positive correlation with the severe profile, .
Figure 6
Figure 6. Zoom of Figure 4, identifying the most distant probes from the origin with positive correlation with the control profile, and negative correlation with the severe profile, .
Figure 7
Figure 7. Heat map of the 50-probe signature and the transcription factors with best p-values, for the whole set of 50 probes and for the two groups considered.
The samples and probes were sorted using the memetic algorithm given in , using the Euclidean distance. The transcription factors were obtained using Chang and Nevins' GATHER system to interpret genomic signatures . The coloured cell and the number 1 indicate that the transcription factor has a binding motif with the gene for that row. The levels of severity as defined by Blalock et al. are indicated in the first line: (0) Control, (1) Incipient AD, (2) Moderate AD and (3) Severe AD.
Figure 8
Figure 8. Heat map of 1,372-probe signature.
The probes were sorted using the memetic algorithm but the samples remain in the same order than the 50-probe signature.
Figure 9
Figure 9. ‘Common-regulators’ 50-probes’ signature.
The figure was obtained using Pathway Studio . The program received as input the 50-probes displayed in Fig. 7 and automatically searched all the known putative common regulators relationships. The highlighted proteins are the 5-protein signature (IL1- α, TNF-α, IL-3, EGF and GCSF) of . We have also highlighted IL-6 (discussed in in the context of results of classifiers that also use it) and CSF1, Colony-stimulating factor 1, (macrophage).
Figure 10
Figure 10. Calcium signaling pathway.
The upper graph presents the stacked normalized expression values of all the probes involved in the Calcium signaling with an upregulation trend. The lower graph analyses the genes involved in the pathway with a downregulation tendency. In the supplementary material (File S3 sheet ‘Calcium signalling pathway’), the reader will find all the individual gene expression values, normalised and not normalised.
Figure 11
Figure 11. Neuroactive ligand-receptor interaction pathway.
The upper graph presents the stacked normalized expression values of all the probes involved in the pathway with an upregulation trend. The lower graph analyses the genes involved in the pathway with a downregulation tendency. In the supplementary material (File S3 sheet ‘Neuroactive ligand-receptor’), the reader will find all the individual gene expression values, normalised and not normalised.
Figure 12
Figure 12. WNT signaling pathway.
The upper graph presents the stacked normalized expression values of all the probes involved in the pathway with an upregulation trend. The lower graph analyses the genes involved in the pathway with a downregulation tendency. In the supplementary material (File S3 sheet ‘Wnt Signalling’), the reader will find all the individual gene expression values, normalised and not normalised.
Figure 13
Figure 13. Phosphatidylinositol signaling pathway.
The upper graph presents the stacked normalized expression values of all the probes involved in the pathway with an upregulation trend. The lower graph analyses the genes involved in the pathway with a downregulation tendency. In the supplementary material (File S3 sheet ‘Phosphatidylinositol signalling’), the reader will find all the individual gene expression values, normalised and not normalised.
Figure 14
Figure 14. Insulin signaling pathway.
The upper graph presents the stacked normalized expression values of all the probes involved in the pathway with an upregulation trend. The lower graph analyses the genes involved in the pathway with a downregulation tendency. In the supplementary material (File S3 sheet ‘Insulin signalling’), the reader will find all the individual gene expression values, normalised and not normalised.
Figure 15
Figure 15. Genes related to synapse and neuronal plasticity.
The upper graph presents the stacked normalized expression values of all the related probes with an upregulation trend. The lower graph analyses the genes involved with a downregulation inclination. In the supplementary material (File S3, Sheet ‘Synapse’), the reader will find all the individual gene expression values, normalised and not normalised.
Figure 16
Figure 16. Metallothionein family.
Stacked line graph of the probes related to the Metallothionein family in the 1372-probe signature.
Figure 17
Figure 17. Stacked line graph of the probe expression of Ferritin Light Chain, Lactotransferrin, and the Methallothionein family, in the 1,372-probe signature, that shows an increasing upregualtion with AD severity.
The expression of a PAX6 probe shows increasing upregualtion with AD severity.
Figure 18
Figure 18. The expression of a QKI probe, like PAX6, also shows increasing upregualtion with AD severity.
Figure 19
Figure 19. The expression of a probe for VSNL1 (Visinin-like protein-1) shows increasing downregualtion with AD severity.
VSNL1, a neuronal calcium sensor that has received recent attention in AD , , , has also been linked to model systems of schizophrenia, where it has been found upregulated in hippocampus . A previous result by Schnurra et al. raised the possibility that the redution of VSNL1 expressing neurons indicate a selective vulnerabilty of these cells, since they observed that VSNL1 expression enhanced hyperphosphorylation of tau protein (in contrast with nontransfected or calbindin-D28K-transfected cells) . In 2001, Braunewell et al. had already reported the reduction of VSNL1-immunoactive neurons in the temporal cortex of AD patients as compared with controls .
Figure 20
Figure 20. It is possible to observe that one of the probes for NRXN1 (Neurexin 1, 209915_s_at) has decreasing expression with increasing AD severity.
We have found no previous evidence of a connection of NRXN1 and AD, but this gene has been previously implicated in autism , , , , , , , schizophrenia , , , , , nicotine and alcoholism dependence , , , and mental retardation .
Figure 21
Figure 21. The expression of two probes for PPP2CA (Protein phosphatase 2 (formerly 2A), catalytic subunit, alpha isoform,) and PPP3CA (Protein phosphatase 3 (formerly 2B), catalytic subunit, alpha isoform, Calcineurin A1) show increasing downregualtion with AD severity.
A similar plot exists for PPP3R1 (protein phosphatase 3 (formerly 2B), regulatory subunit B, alpha isoform, Calcineurin subunit B type 1). This result supports a role for downregulation of PPP2CA, PPP3CA in AD pathology , , , , , , , , , , , , , , , , , , , , , , , , , , , , .

Similar articles

Cited by

References

    1. Gomez Ravetti M, Moscato P. Identification of a 5-Protein Biomarker Molecular Signature for Predicting Alzheimer's Disease. PLoS One. 2008;3:e3111. - PMC - PubMed
    1. Ray S, Britschgi M, Herbert C, Takeda-Uchimura Y, Boxer A, et al. Classification and prediction of clinical Alzheimer's diagnosis based on plasma signaling proteins. Nat Med. 2007;13:1359–1362. - PubMed
    1. Blalock EM, Geddes JW, Chen KC, Porter NM, Markesbery WR, et al. Incipient Alzheimer's disease: Microarray correlation analyses reveal major transcriptional and tumor suppressor responses. Proceedings of the National Academy of Sciences of the United States of America. 2004;101:2173–2178. - PMC - PubMed
    1. Schmitt FA, Davis DG, Wekstein DR, Smith CD, Ashford JW, et al. “Preclinical” AD revisited: Neuropathology of cognitively normal older adults. Neurology. 2000;55:370–376. - PubMed
    1. Haroutunian V, Purohit DP, Perl DP, Marin D, Khan K, et al. Neurofibrillary Tangles in Nondemented Elderly Subjects and Mild Alzheimer Disease. Arch Neurol. 1999;56:713–718. - PubMed

Publication types

MeSH terms