. 2010 Apr 12;5(4):e10132.
doi: 10.1371/journal.pone.0010132.

Hydrogenase-3 contributes to anaerobic acid resistance of Escherichia coli

Affiliations

Hydrogenase-3 contributes to anaerobic acid resistance of Escherichia coli

Ken Noguchi et al. PLoS One. .

Abstract

Background: Hydrogen production by fermenting bacteria such as Escherichia coli offers a potential source of hydrogen biofuel. Because H(2) production involves consumption of 2H(+), hydrogenase expression is likely to involve pH response and regulation. Hydrogenase consumption of protons in E. coli has been implicated in acid resistance, the ability to survive exposure to acid levels (pH 2-2.5) that are three pH units lower than the pH limit of growth (pH 5-6). Enhanced survival in acid enables a larger infective inoculum to pass through the stomach and colonize the intestine. Most acid resistance mechanisms have been defined using aerobic cultures, but the use of anaerobic cultures will reveal novel acid resistance mechanisms.

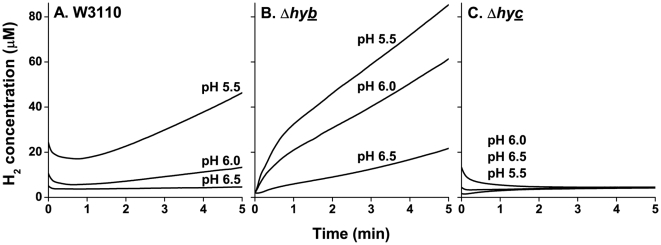
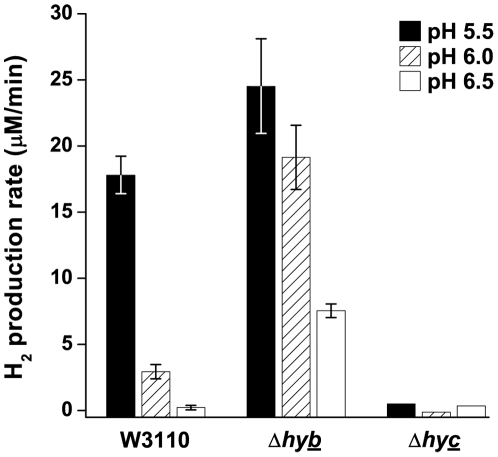
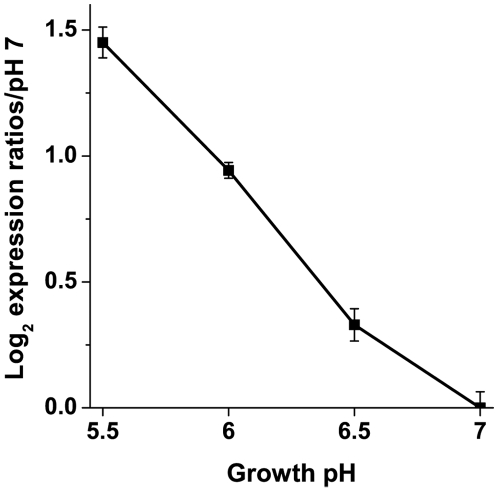
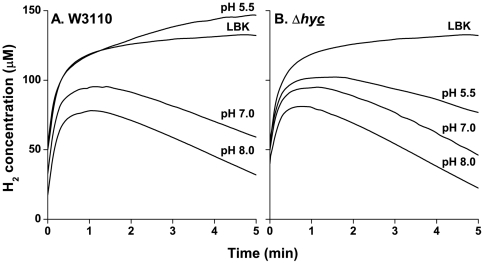
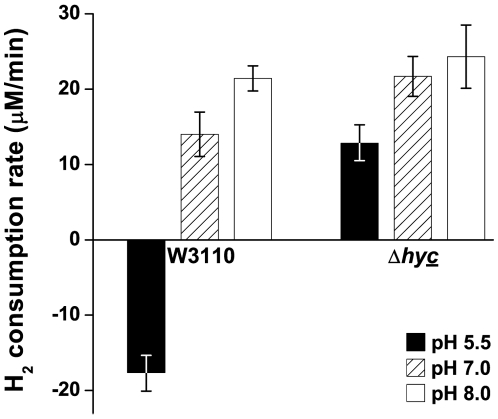
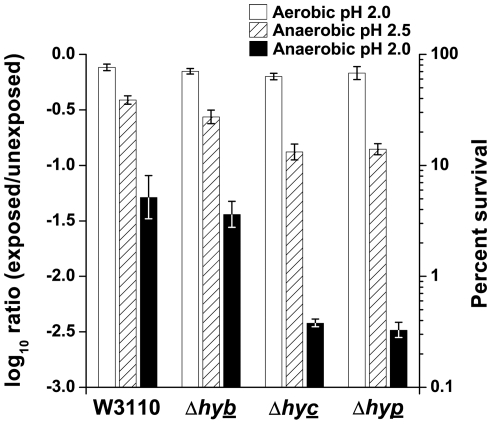
Methods and principal findings: We analyzed the pH regulation of bacterial hydrogenases in live cultures of E. coli K-12 W3110. During anaerobic growth in the range of pH 5 to 6.5, E. coli expresses three hydrogenase isoenzymes that reversibly oxidize H(2) to 2H(+). Anoxic conditions were used to determine which of the hydrogenase complexes contribute to acid resistance, measured as the survival of cultures grown at pH 5.5 without aeration and exposed for 2 hours at pH 2 or at pH 2.5. Survival of all strains in extreme acid was significantly lower in low oxygen than for aerated cultures. Deletion of hyc (Hyd-3) decreased anoxic acid survival 3-fold at pH 2.5, and 20-fold at pH 2, but had no effect on acid survival with aeration. Deletion of hyb (Hyd-2) did not significantly affect acid survival. The pH-dependence of H(2) production and consumption was tested using a H(2)-specific Clark-type electrode. Hyd-3-dependent H(2) production was increased 70-fold from pH 6.5 to 5.5, whereas Hyd-2-dependent H(2) consumption was maximal at alkaline pH. H(2) production, was unaffected by a shift in external or internal pH. H(2) production was associated with hycE expression levels as a function of external pH.

Conclusions: Anaerobic growing cultures of E. coli generate H(2) via Hyd-3 at low external pH, and consume H(2) via Hyd-2 at high external pH. Hyd-3 proton conversion to H(2) is required for acid resistance in anaerobic cultures of E. coli.


Conflict of interest statement

Competing Interests: The authors have declared that no competing interests exist.

Figures

Figure 1
Figure 1. Effect of pH on the H2 production by W3110, ΔhybC, and ΔhycE.
The lines represent traces of H2 concentration as a function of time. Before time 0, the cultures were sparged with 100% N2 in order to eliminate any residual H2 in the culture. Anaerobic cultures of W3110 (A), ΔhybC (B), and ΔhycE (C) were grown to log phase at pH 5.5, pH 6, and pH 6.5 and assayed for H2 production as stated in the Materials and Methods. Lines are representative samples of n = 3.
Figure 2
Figure 2. Effect of pH on the H2 production rate of W3110, ΔhybC, and ΔhycE.
Anaerobic cultures were grown to log phase at pH 5.5 (black bars), 6 (hatched bars), and 6.5 (white bars) and assayed for H2 production as described in the Materials and Methods. H2 production rate was calculated as stated in the Materials and Methods. Error bars represent SEM, n = 3; those that were too small to see clearly were omitted. The experiment was conducted twice.
Figure 3
Figure 3. hycE gene expression in W3110.
RNA was isolated from anaerobic cultures grown to log phase at pH 5.5, 6, 6.5, and 7. Real-Time PCR was used to measure the mRNA levels of hycE, the large subunit of Hyd-3. Expression levels were normalized to the pH 7 control. Error bars represent SEM, n = 3 (RNA from independent cultures). The experiment was conducted twice.
Figure 4
Figure 4. Effect of pH on the H2 consumption by W3110 and ΔhycE.
The lines represent traces of H2 concentration as a function of time. Before time 0 the cultures were sparged with 20% H2/80% N2 in order to saturate the culture with H2. Anaerobic cultures of W3110 (A) and ΔhycE (B) were grown to log phase at pH 5.5, pH 7, and pH 8 and assayed for H2 consumption as stated in the Materials and Methods. A sample of LBK saturated with H2 was assayed as a control to assess residual H2 loss. Lines are representative samples of n = 3.
Figure 5
Figure 5. Effect of pH on the H2 consumption rate of W3110 and ΔhycE.
Anaerobic cultures were grown to log phase under anaerobic conditions at pH 5.5 (black bars), 7 (hatched bars), and 8 (white bars) and assayed for H2 consumption as described in the Materials and Methods. A negative value for H2 consumption means H2 is produced. H2 consumption rate was calculated as stated in the Materials and Methods. Error bars represent SEM, n = 3. The experiment was conducted twice.
Figure 6
Figure 6. Effect of aeration on the extreme acid survival of W3110, ΔhybC, ΔhycE, and ΔhypF.
The white bars represent cultures grown with aeration to stationary phase in LBK buffered at pH 5 that were diluted 200-fold into LBK pH 2 and exposed for 2 h with aeration at 37°C. The hatched and black bars represent anaerobic cultures grown to stationary phase in LBK buffered at pH 5.5 that were diluted 200-fold into LBK pH 2.5 (hatched) or pH 2 (black) and exposed for 2 h without aeration at 37°C. Aerobic and anaerobic cultures were maintained as stated in the Materials and Methods. Error bars represent SEM, n = 5 or 6.

Similar articles

Cited by

References

    1. Hansel A, Lindblad P. Towards optimization of cyanobacteria as biotechnologically relevant producers of molecular hydrogen, a clean and renewable energy source. Appl Microbiol Biotechnol. 1998;50:153–160.
    1. Valdez-Vazquez I, Poggi-Varaldo HM. Hydrogen production by fermentative consortia. Renewable Sustainable Energy Rev. 2009;13:1000–1013.
    1. Moss AR, Jouany J-P, Newbold J. Methane production by ruminants: its contribution to global warming. Ann Zootech. 2000;49:231–253.
    1. Olson JW, Maier RJ. Molecular hydrogen as an energy source of Helicobacter pylori. Science. 2002;298:1788–1790. - PubMed
    1. Maier RJ, Olczak A, Maier S, Soni S, Gunn J. Respiratory hydrogen use by Salmonella enterica serovar Typhimurium is essential for virulence. Infect Immun. 2004;72:6294–6299. - PMC - PubMed

Publication types

LinkOut - more resources