

HIV-1 subtype C-infected individuals maintaining high viral load as potential targets for the "test-and-treat" approach to reduce HIV transmission
- PMID: 20405044
- PMCID: PMC2853582
- DOI: 10.1371/journal.pone.0010148
HIV-1 subtype C-infected individuals maintaining high viral load as potential targets for the "test-and-treat" approach to reduce HIV transmission
Abstract
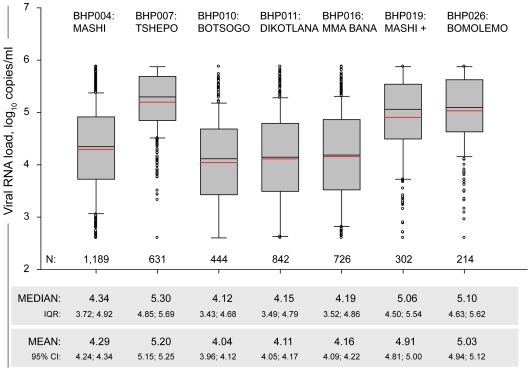
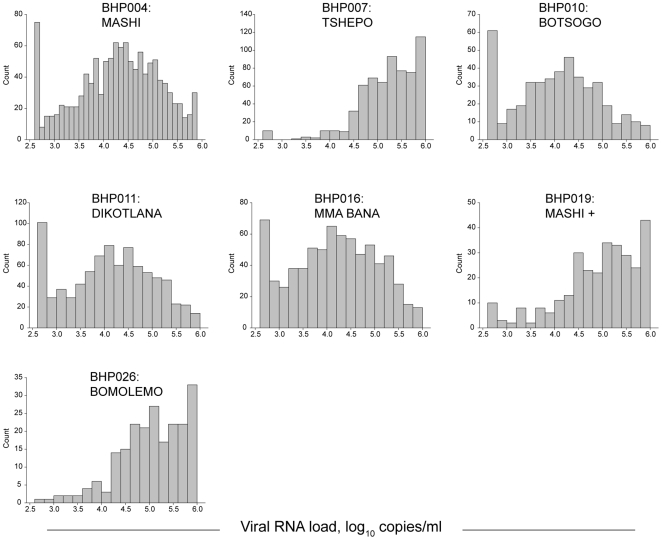
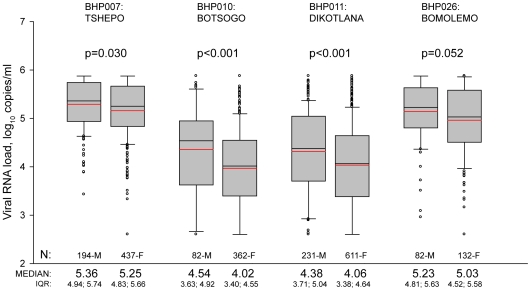
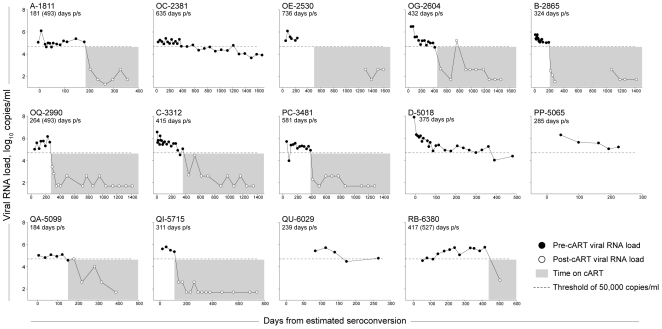
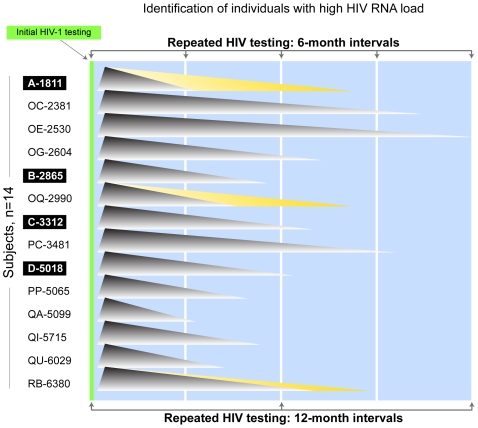
The first aim of the study is to assess the distribution of HIV-1 RNA levels in subtype C infection. Among 4,348 drug-naïve HIV-positive individuals participating in clinical studies in Botswana, the median baseline plasma HIV-1 RNA levels differed between the general population cohorts (4.1-4.2 log(10)) and cART-initiating cohorts (5.1-5.3 log(10)) by about one log(10). The proportion of individuals with high (> or = 50,000 (4.7 log(10)) copies/ml) HIV-1 RNA levels ranged from 24%-28% in the general HIV-positive population cohorts to 65%-83% in cART-initiating cohorts. The second aim is to estimate the proportion of individuals who maintain high HIV-1 RNA levels for an extended time and the duration of this period. For this analysis, we estimate the proportion of individuals who could be identified by repeated 6- vs. 12-month-interval HIV testing, as well as the potential reduction of HIV transmission time that can be achieved by testing and ARV treating. Longitudinal analysis of 42 seroconverters revealed that 33% (95% CI: 20%-50%) of individuals maintain high HIV-1 RNA levels for at least 180 days post seroconversion (p/s) and the median duration of high viral load period was 350 (269; 428) days p/s. We found that it would be possible to identify all HIV-infected individuals with viral load > or = 50,000 (4.7 log(10)) copies/ml using repeated six-month-interval HIV testing. Assuming individuals with high viral load initiate cART after being identified, the period of high transmissibility due to high viral load can potentially be reduced by 77% (95% CI: 71%-82%). Therefore, if HIV-infected individuals maintaining high levels of plasma HIV-1 RNA for extended period of time contribute disproportionally to HIV transmission, a modified "test-and-treat" strategy targeting such individuals by repeated HIV testing (followed by initiation of cART) might be a useful public health strategy for mitigating the HIV epidemic in some communities.
Conflict of interest statement
Figures
References
-
- Mellors JW, Munoz A, Giorgi JV, Margolick JB, Tassoni CJ, et al. Plasma viral load and CD4+ lymphocytes as prognostic markers of HIV-1 infection. Ann Intern Med. 1997;126:946–954. - PubMed
-
- de Wolf F, Spijkerman I, Schellekens PT, Langendam M, Kuiken C, et al. AIDS prognosis based on HIV-1 RNA, CD4+ T-cell count and function: markers with reciprocal predictive value over time after seroconversion. AIDS. 1997;11:1799–1806. - PubMed
-
- Blattner WA, Ann Oursler K, Cleghorn F, Charurat M, Sill A, et al. Rapid clearance of virus after acute HIV-1 infection: correlates of risk of AIDS. J Infect Dis. 2004;189:1793–1801. - PubMed
-
- Quinn TC, Wawer MJ, Sewankambo N, Serwadda D, Li C, et al. Viral load and heterosexual transmission of human immunodeficiency virus type 1. Rakai Project Study Group. N Engl J Med. 2000;342:921–929. - PubMed
Publication types
MeSH terms
Substances
Grants and funding
- R01 AI057027/AI/NIAID NIH HHS/United States
- R01 HD037793/HD/NICHD NIH HHS/United States
- R01 HD37793/HD/NICHD NIH HHS/United States
- R01 HD044391/HD/NICHD NIH HHS/United States
- R37 AI24643/AI/NIAID NIH HHS/United States
- R37 AI024643/AI/NIAID NIH HHS/United States
- R01 AI052032/AI/NIAID NIH HHS/United States
- R37 AI051164/AI/NIAID NIH HHS/United States
- R01 AI051164/AI/NIAID NIH HHS/United States
- K23 AI073141/AI/NIAID NIH HHS/United States
- R01 DA016551/DA/NIDA NIH HHS/United States
- R01 HD44391/HD/NICHD NIH HHS/United States
- U01 AI066454/AI/NIAID NIH HHS/United States
LinkOut - more resources
Full Text Sources
Medical
