. 2010 Apr 13;7(4):e1000253.
doi: 10.1371/journal.pmed.1000253.

Measuring under-five mortality: validation of new low-cost methods

Affiliations

Measuring under-five mortality: validation of new low-cost methods

Julie Knoll Rajaratnam et al. PLoS Med. .

Abstract

Background: There has been increasing interest in measuring under-five mortality as a health indicator and as a critical measure of human development. In countries with complete vital registration systems that capture all births and deaths, under-five mortality can be directly calculated. In the absence of a complete vital registration system, however, child mortality must be estimated using surveys that ask women to report the births and deaths of their children. Two survey methods exist for capturing this information: summary birth histories and complete birth histories. A summary birth history requires a minimum of only two questions: how many live births has each mother had and how many of them have survived. Indirect methods are then applied using the information from these two questions and the age of the mother to estimate under-five mortality going back in time prior to the survey. Estimates generated from complete birth histories are viewed as the most accurate when surveys are required to estimate under-five mortality, especially for the most recent time periods. However, it is much more costly and labor intensive to collect these detailed data, especially for the purpose of generating small area estimates. As a result, there is a demand for improvement of the methods employing summary birth history data to produce more accurate as well as subnational estimates of child mortality.

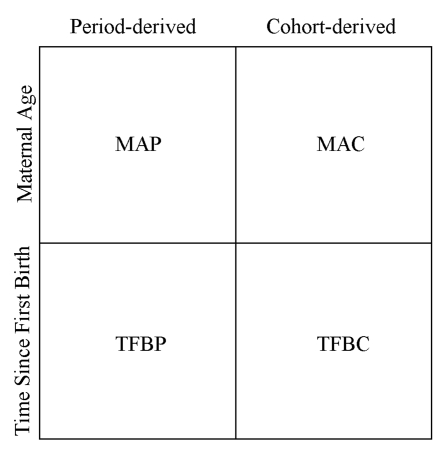
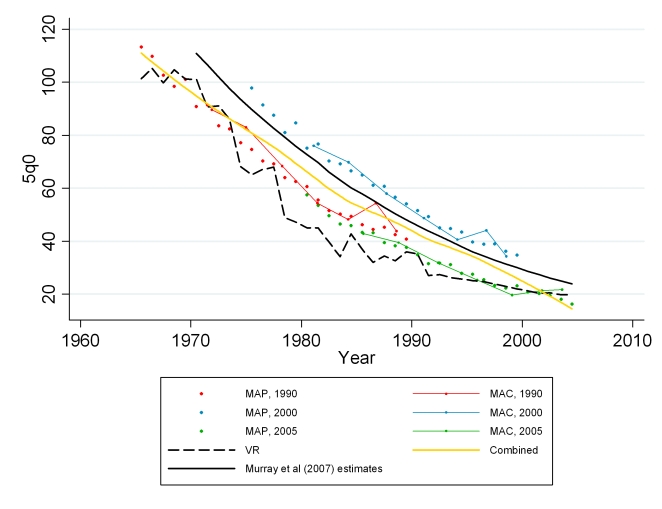
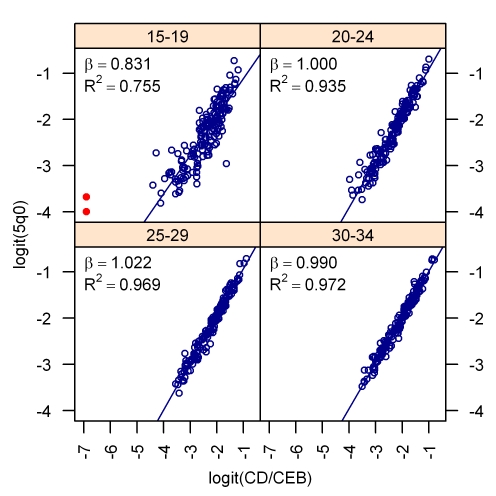
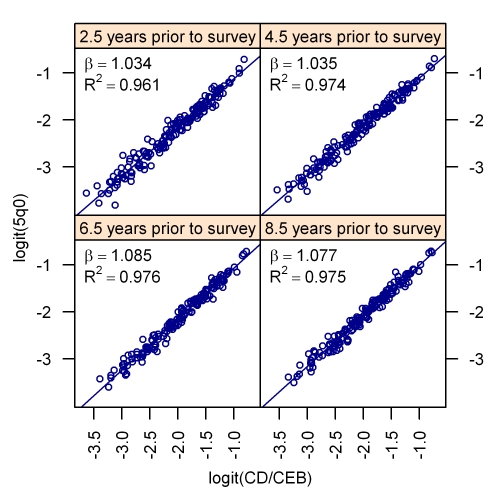
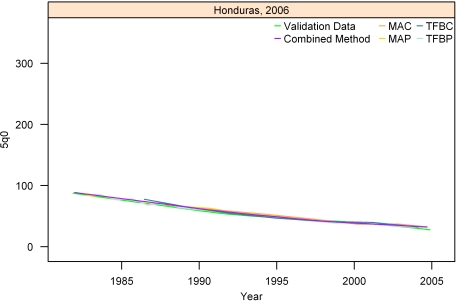
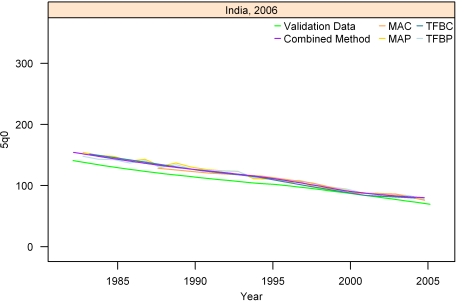
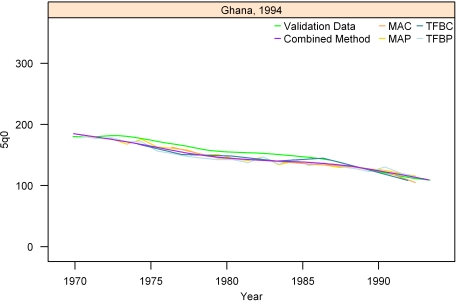
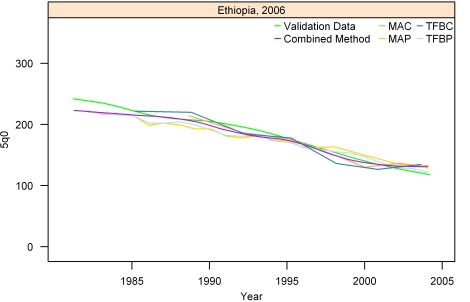
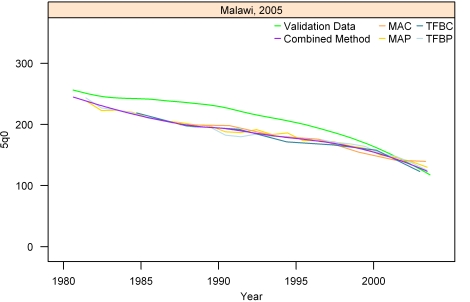
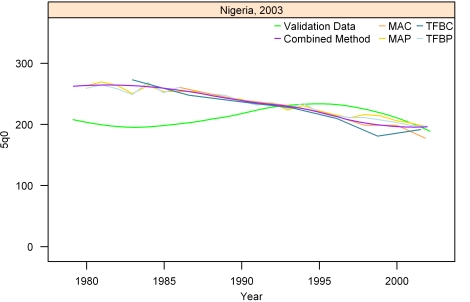
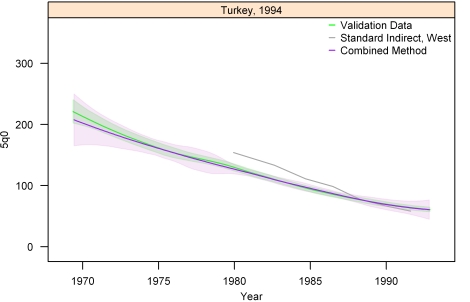
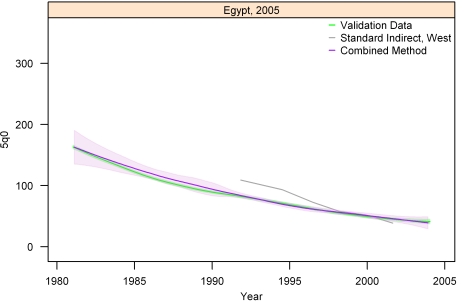
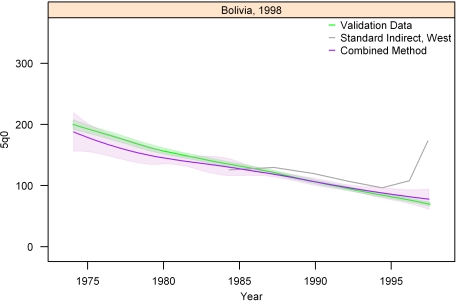
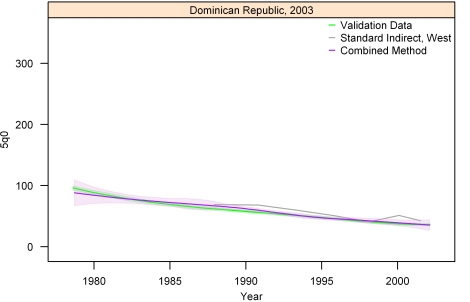
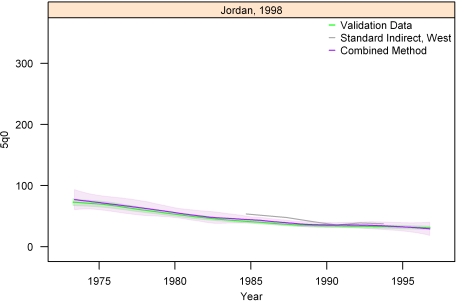
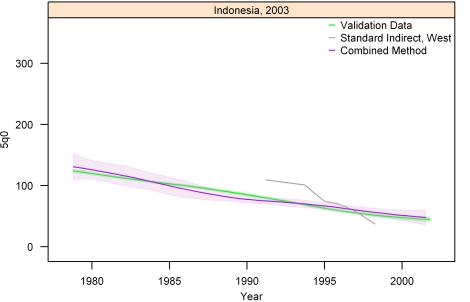
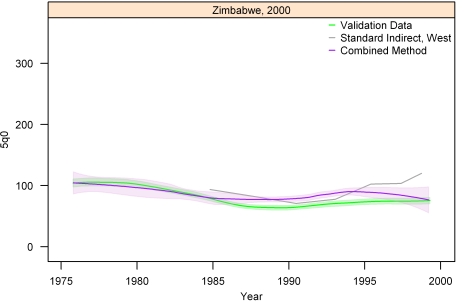
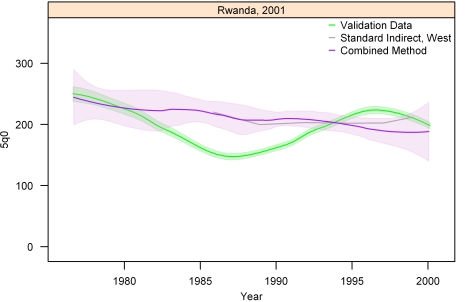
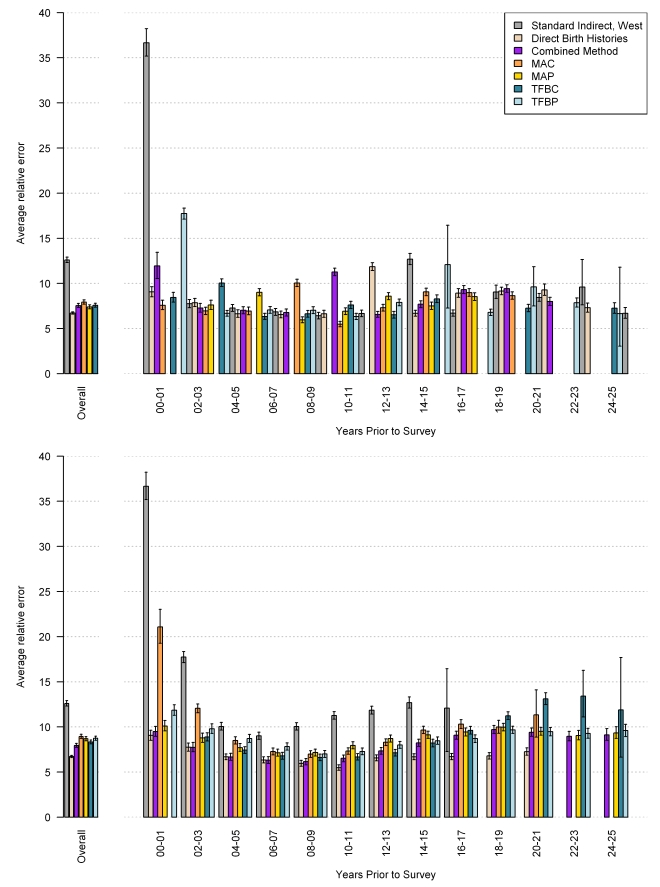
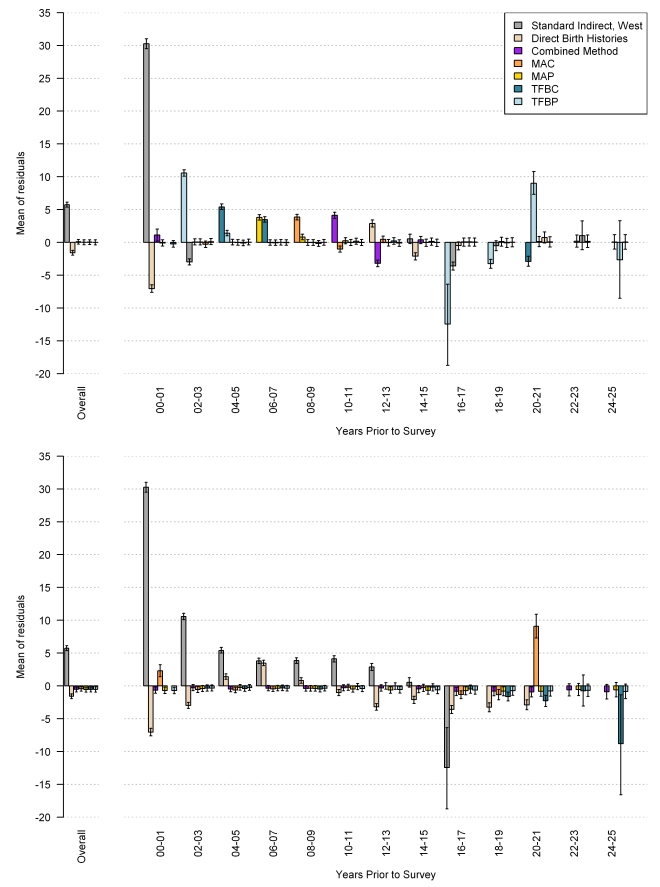
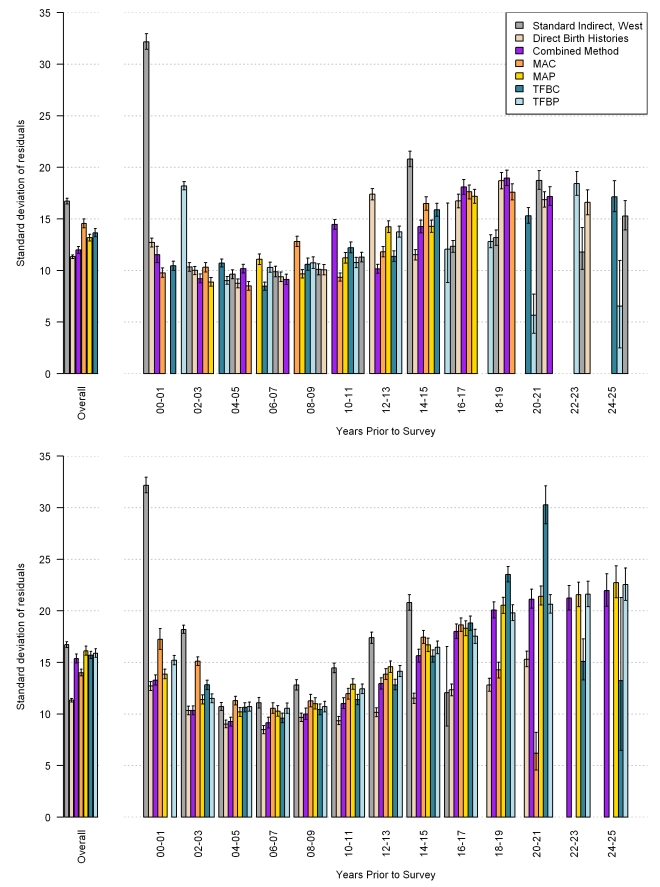
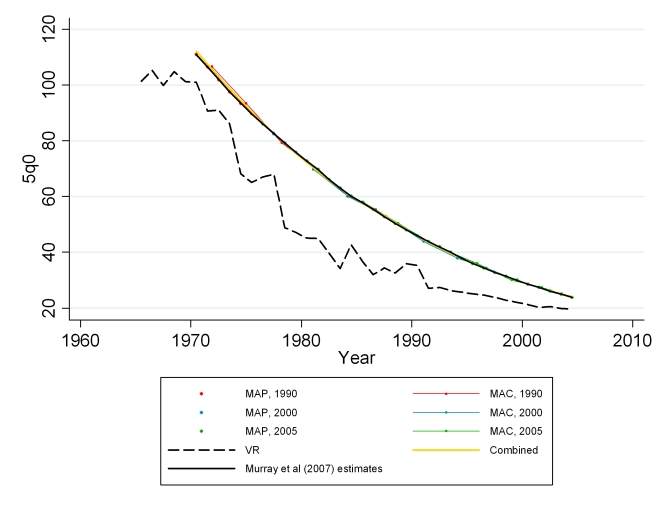
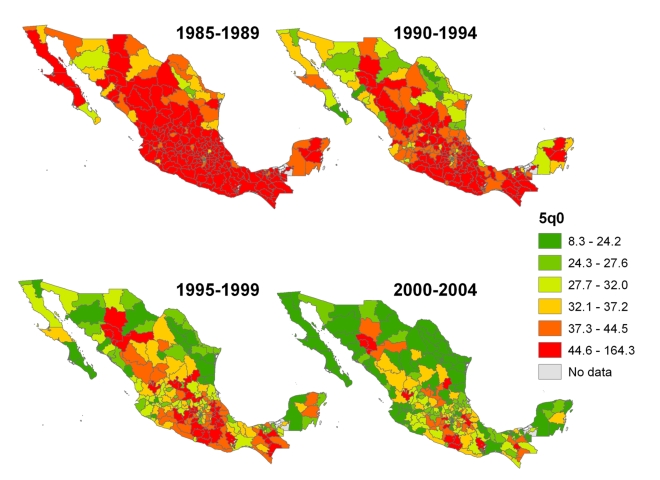
Methods and findings: We used data from 166 Demographic and Health Surveys (DHS) to develop new empirically based methods of estimating under-five mortality using children ever born and children dead data. We then validated them using both in- and out-of-sample analyses. We developed a range of methods on the basis of three dimensions of the problem: (1) approximating the average length of exposure to mortality from a mother's set of children using either maternal age or time since first birth; (2) using cohort and period measures of the fraction of children ever born that are dead; and (3) capturing country and regional variation in the age pattern of fertility and mortality. We focused on improving estimates in the most recent time periods prior to a survey where the traditional indirect methods fail. In addition, all of our methods incorporated uncertainty. Validated against under-five estimates generated from complete birth histories, our methods outperformed the standard indirect method by an average of 43.7% (95% confidence interval [CI] 41.2-45.2). In the 5 y prior to the survey, the new methods resulted in a 53.3% (95% CI 51.3-55.2) improvement. To illustrate the value of this method for local area estimation, we applied our new methods to an analysis of summary birth histories in the 1990, 2000, and 2005 Mexican censuses, generating subnational estimates of under-five mortality for each of 233 jurisdictions.

Conclusions: The new methods significantly improve the estimation of under-five mortality using summary birth history data. In areas without vital registration data, summary birth histories can provide accurate estimates of child mortality. Because only two questions are required of a female respondent to generate these data, they can easily be included in existing survey programs as well as routine censuses of the population. With the wider application of these methods to census data, countries now have the means to generate estimates for subnational areas and population subgroups, important for measuring and addressing health inequalities and developing local policy to improve child survival. Please see later in the article for the Editors' Summary.


Conflict of interest statement

Alan Lopez is on the Editorial Board of PLoS Medicine.

Figures

Figure 1
Figure 1. Classification of four new methods to generate estimates of under-five mortality from summary birth history data.
Figure 2
Figure 2. Example distributions of children ever born used to generate the period ratio of CD/CEB in the MAP method (sub-Saharan Africa, West/Central region).
Similar distributions over time prior to the survey are generated for each category of single year of age and number of children ever born, for each of the five regions. The same is done for distributions of deaths (not shown in this graph). The distributions from the applicable region are then applied to every mother in the dataset to generate the expected distribution of births and deaths of her children across time prior to the survey. For example, according to the distributions shown above, a 24-y-old woman from this region with three children would be expected to have had 12% of them in the past year, 10.2% in the second year prior to the survey, 10% in the third year prior to the survey, and so on down to small fractions of children expected in the 13th, 14th, and 15th year prior to the survey. For each year prior to the survey, the total number of expected children dead and children ever born is calculated using the expected values across all age groups. The TFBP method applies similar logic, but groups mothers according to the number of years since their first birth rather than by age.
Figure 3
Figure 3. Lexis diagram showing the summation of expected births (EBs) across women of all ages for each year prior to the survey for the MAP method.
The same concept is applied to expected deaths for each year prior to the survey and then the two quantities are used to compute the period-derived ratio of CD/CEB.
Figure 4
Figure 4. Estimates of under-five mortality generated from summary birth histories from three censuses (1990, 2000, 2005) in Mexico using MAP, MAC, and the combined methods.
Summary birth history estimates are compared with national-level estimates from vital registration, the standard indirect method, and Murray et al. .
Figure 5
Figure 5. The bivariate relationship between child mortality and the CD/CEB ratio after logit transformation.
The relationship between the cohort measure of CD/CEB for four different age groups of mothers is shown. The red points are outliers that were excluded from the model.
Figure 6
Figure 6. The bivariate relationship between child mortality and the ratio of children dead to children ever born after logit transformation.
The relationship for the period measure of CD/CEB for four periods prior to the survey is shown.
Figure 7
Figure 7. Estimates of under-five mortality generated from summary birth histories using MAP, MAC, TFBP, TFBC, and Combined method. Honduras, 2006.
The gold standard derived from complete birth histories is also shown. The six examples in Figures 7-12 represent different levels of performance of the Combined method, in order from best to worst.
Figure 8
Figure 8. Estimates of under-five mortality generated from summary birth histories using MAP, MAC, TFBP, TFBC, and Combined method. India, 2006.
The gold standard derived from complete birth histories is also shown. The six examples in Figures 7-12 represent different levels of performance of the Combined method, in order from best to worst.
Figure 9
Figure 9. Estimates of under-five mortality generated from summary birth histories using MAP, MAC, TFBP, TFBC, and Combined method. Ghana, 1994.
The gold standard derived from complete birth histories is also shown. The six examples in Figures 7-12 represent different levels of performance of the Combined method, in order from best to worst.
Figure 10
Figure 10. Estimates of under-five mortality generated from summary birth histories using MAP, MAC, TFBP, TFBC, and Combined method. Ethiopia, 2006.
The gold standard derived from complete birth histories is also shown. The six examples in Figures 7-12 represent different levels of performance of the Combined method, in order from best to worst.
Figure 11
Figure 11. Estimates of under-five mortality generated from summary birth histories using MAP, MAC, TFBP, TFBC, and Combined method. Malawi, 2005.
The gold standard derived from complete birth histories is also shown. The six examples in Figures 7-12 represent different levels of performance of the Combined method, in order from best to worst.
Figure 12
Figure 12. Estimates of under-five mortality generated from summary birth histories using MAP, MAC, TFBP, TFBC, and Combined method. Nigeria, 2003.
The gold standard derived from complete birth histories is also shown. The six examples in Figures 7-12 represent different levels of performance of the Combined method, in order from best to worst.
Figure 13
Figure 13. Graphs of estimates from summary birth histories using the best-performing combined method and the standard indirect (West) method. Section I, Turkey, 1994.
The gold standard generated from complete birth histories is also shown. Section I (Figures 13– 16) shows four surveys that best illustrate the improvement in measurement of under-five mortality when the combined method is used as compared to the standard method. Section II (Figures 17– 20) shows four surveys that provide a more balanced representation of the performance of the combined method, including the surveys that perform at the best, 33rd, 66th, and worst percentiles, in that order, on the basis of the standard deviation of residuals metric.
Figure 14
Figure 14. Graphs of estimates from summary birth histories using the best-performing combined method and the standard indirect (West) method. Section I, Egypt, 2005.
The gold standard generated from complete birth histories is also shown. Section I (Figures 13– 16) shows four surveys that best illustrate the improvement in measurement of under-five mortality when the combined method is used as compared to the standard method. Section II (Figures 17– 20) shows four surveys that provide a more balanced representation of the performance of the combined method, including the surveys that perform at the best, 33rd, 66th, and worst percentiles, in that order, on the basis of the standard deviation of residuals metric.
Figure 15
Figure 15. Graphs of estimates from summary birth histories using the best-performing combined method and the standard indirect (West) method. Section I, Bolivia, 1998.
The gold standard generated from complete birth histories is also shown. Section I (Figures 13– 16) shows four surveys that best illustrate the improvement in measurement of under-five mortality when the combined method is used as compared to the standard method. Section II (Figures 17– 20) shows four surveys that provide a more balanced representation of the performance of the combined method, including the surveys that perform at the best, 33rd, 66th, and worst percentiles, in that order, on the basis of the standard deviation of residuals metric.
Figure 16
Figure 16. Graphs of estimates from summary birth histories using the best-performing combined method and the standard indirect (West) method. Section I, Dominican Republic, 2003.
The gold standard generated from complete birth histories is also shown. Section I (Figures 13– 16) shows four surveys that best illustrate the improvement in measurement of under-five mortality when the combined method is used as compared to the standard method. Section II (Figures 17– 20) shows four surveys that provide a more balanced representation of the performance of the combined method, including the surveys that perform at the best, 33rd, 66th, and worst percentiles, in that order, on the basis of the standard deviation of residuals metric.
Figure 17
Figure 17. Graphs of estimates from summary birth histories using the best-performing combined method and the standard indirect (West) method. Section II, Jordan, 1998.
The gold standard generated from complete birth histories is also shown. Section I (Figures 13– 16) shows four surveys that best illustrate the improvement in measurement of under-five mortality when the combined method is used as compared to the standard method. Section II (Figures 17– 20) shows four surveys that provide a more balanced representation of the performance of the combined method, including the surveys that perform at the best, 33rd, 66th, and worst percentiles, in that order, on the basis of the standard deviation of residuals metric.
Figure 18
Figure 18. Graphs of estimates from summary birth histories using the best-performing combined method and the standard indirect (West) method. Section II, Indonesia, 2003.
The gold standard generated from complete birth histories is also shown. Section I (Figures 13– 16) shows four surveys that best illustrate the improvement in measurement of under-five mortality when the combined method is used as compared to the standard method. Section II (Figures 17– 20) shows four surveys that provide a more balanced representation of the performance of the combined method, including the surveys that perform at the best, 33rd, 66th, and worst percentiles, in that order, on the basis of the standard deviation of residuals metric.
Figure 19
Figure 19. Graphs of estimates from summary birth histories using the best-performing combined method and the standard indirect (West) method. Section II, Zimbabwe, 2000.
The gold standard generated from complete birth histories is also shown. Section I (Figures 13– 16) shows four surveys that best illustrate the improvement in measurement of under-five mortality when the combined method is used as compared to the standard method. Section II (Figures 17– 20) shows four surveys that provide a more balanced representation of the performance of the combined method, including the surveys that perform at the best, 33rd, 66th, and worst percentiles, in that order, on the basis of the standard deviation of residuals metric.
Figure 20
Figure 20. Graphs of estimates from summary birth histories using the best-performing combined method and the standard indirect (West) method. Section II, Rwanda, 2001.
The gold standard generated from complete birth histories is also shown. Section I (Figures 13– 16) shows four surveys that best illustrate the improvement in measurement of under-five mortality when the combined method is used as compared to the standard method. Section II (Figures 17– 20) shows four surveys that provide a more balanced representation of the performance of the combined method, including the surveys that perform at the best, 33rd, 66th, and worst percentiles, in that order, on the basis of the standard deviation of residuals metric.
Figure 21
Figure 21. Performance of MAC, TFBC, MAP, TFBP, and combined methods as measured by average relative error.
Estimates generated by complete birth histories from a single survey are also compared to the validation dataset. The top section of each panel represents the in-sample performance, and the bottom section is the average out-of-sample performance across all five hold-out groups.
Figure 22
Figure 22. Performance of MAC, TFBC, MAP, TFBP, and combined methods as measured by mean of residuals.
Estimates generated by complete birth histories from a single survey are also compared to the validation dataset. The top section of each panel represents the in-sample performance, and the bottom section is the average out-of-sample performance across all five hold-out groups.
Figure 23
Figure 23. Performance of MAC, TFBC, MAP, TFBP, and combined methods as measured by standard deviation of residuals.
Estimates generated by complete birth histories from a single survey are also compared to the validation dataset. The top section of each panel represents the in-sample performance, and the bottom section is the average out-of-sample performance across all five hold-out groups.
Figure 24
Figure 24. Estimates of under-five mortality generated from summary birth histories from three censuses (1990, 2000, 2005) in Mexico using MAP, MAC, and the combined methods.
Summary birth history estimates are calibrated to national-level estimates from Murray et al. .
Figure 25
Figure 25. Estimates of under-five mortality by jurisdiction in Mexico, using the combined method approach of applying Loess regression to MAP and MAC estimates from the 1990, 2000, and 2005 censuses.

Similar articles

Cited by

References

    1. United Nations. World declaration on the survival, protection and development of children and plan of action for implementing the world declaration on the survival, protection and development of children in the 1990s: World summit for children. 1990. New York: UN Publications. Available: http://www.unicef.org/wsc/plan.htm. Accessed 27 August 2009. - PubMed
    1. Murray CJ, Laakso T, Shibuya K, Hill K, Lopez AD. Can we achieve Millennium Development Goal 4? New analysis of country trends and forecasts of under-5 mortality to 2015. Lancet. 2007;370:1040–1054. - PubMed
    1. Black RE, Morris SS, Bryce J. Where and why are 10 million children dying every year? Lancet. 2003;361:2226–2234. - PubMed
    1. Bryce J, el AS, Pariyo G, Lanata C, Gwatkin D, et al. Reducing child mortality: can public health deliver? Lancet. 2003;362:159–164. - PubMed
    1. Claeson M, Gillespie D, Mshinda H, Troedsson H, Victora CG. Knowledge into action for child survival. Lancet. 2003;362:323–327. - PubMed

Publication types