

Detection of unrealistic molecular environments in protein structures based on expected electron densities
- PMID: 20405167
- PMCID: PMC2859164
- DOI: 10.1007/s10858-010-9408-x
Detection of unrealistic molecular environments in protein structures based on expected electron densities
Abstract
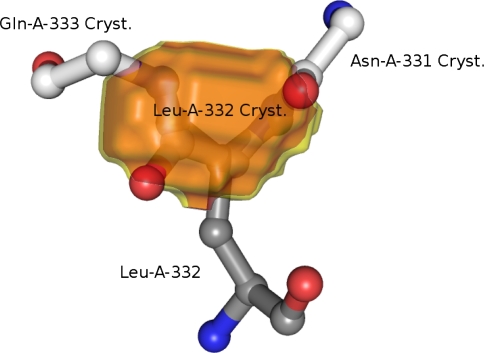
Understanding the relationship between protein structure and biological function is a central theme in structural biology. Advances are severely hampered by errors in experimentally determined protein structures. Detection and correction of such errors is therefore of utmost importance. Electron densities in molecular structures obey certain rules which depend on the molecular environment. Here we present and discuss a new approach that relates electron densities computed from a structural model to densities expected from prior observations on identical or closely related molecular environments. Strong deviations of computed from expected densities reveal unrealistic molecular structures. Most importantly, structure analysis and error detection are independent of experimental data and hence may be applied to any structural model. The comparison to state-of-the-art methods reveals that our approach is able to identify errors that formerly remained undetected. The new technique, called RefDens, is accessible as a public web service at http://refdens.services.came.sbg.ac.at.
Figures


Similar articles
-
Real space refinement of crystal structures with canonical distributions of electrons.Structure. 2011 Dec 7;19(12):1739-43. doi: 10.1016/j.str.2011.10.011. Structure. 2011. PMID: 22153496 Free PMC article.
-
Visualization of unfavorable interactions in protein folds.Bioinformatics. 2008 May 1;24(9):1206-7. doi: 10.1093/bioinformatics/btn108. Epub 2008 Mar 29. Bioinformatics. 2008. PMID: 18375963
-
Protein-protein docking benchmark version 4.0.Proteins. 2010 Nov 15;78(15):3111-4. doi: 10.1002/prot.22830. Proteins. 2010. PMID: 20806234 Free PMC article.
-
A tour of structural genomics.Nat Rev Genet. 2001 Oct;2(10):801-9. doi: 10.1038/35093574. Nat Rev Genet. 2001. PMID: 11584296 Review.
-
Integrative Structural Biology in the Era of Accurate Structure Prediction.J Mol Biol. 2021 Oct 1;433(20):167127. doi: 10.1016/j.jmb.2021.167127. Epub 2021 Jul 3. J Mol Biol. 2021. PMID: 34224746 Review.
Cited by
-
Alternative protein-protein interfaces are frequent exceptions.PLoS Comput Biol. 2012;8(8):e1002623. doi: 10.1371/journal.pcbi.1002623. Epub 2012 Aug 2. PLoS Comput Biol. 2012. PMID: 22876170 Free PMC article.
-
Escaping the cut by restriction enzymes through single-strand self-annealing of host-edited 12-bp and longer synthetic palindromes.DNA Cell Biol. 2012 Feb;31(2):151-63. doi: 10.1089/dna.2011.1339. Epub 2011 Sep 6. DNA Cell Biol. 2012. PMID: 21895510 Free PMC article.
-
SHIFTX2: significantly improved protein chemical shift prediction.J Biomol NMR. 2011 May;50(1):43-57. doi: 10.1007/s10858-011-9478-4. Epub 2011 Mar 30. J Biomol NMR. 2011. PMID: 21448735 Free PMC article.
-
Real space refinement of crystal structures with canonical distributions of electrons.Structure. 2011 Dec 7;19(12):1739-43. doi: 10.1016/j.str.2011.10.011. Structure. 2011. PMID: 22153496 Free PMC article.
References
Publication types
MeSH terms
Substances
Grants and funding
LinkOut - more resources
Full Text Sources
