Review
. 2010 Apr;4(2):241-63.
doi: 10.2217/bmm.10.1.

Intracellular coenzymes as natural biomarkers for metabolic activities and mitochondrial anomalies

Affiliations
Review

Intracellular coenzymes as natural biomarkers for metabolic activities and mitochondrial anomalies

Ahmed A Heikal. Biomark Med. 2010 Apr.

Abstract

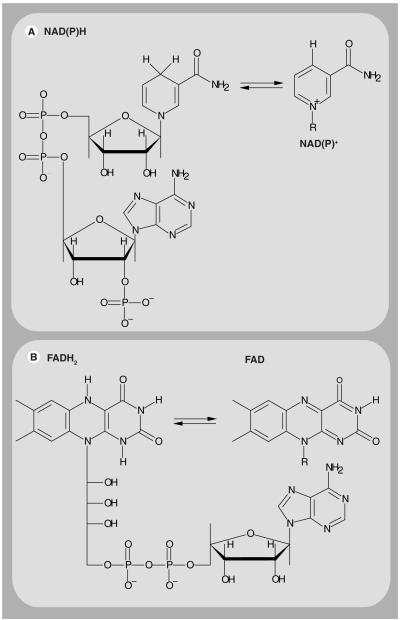
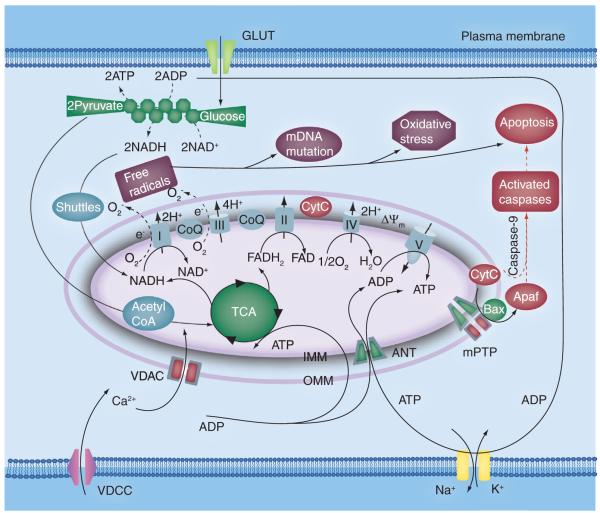
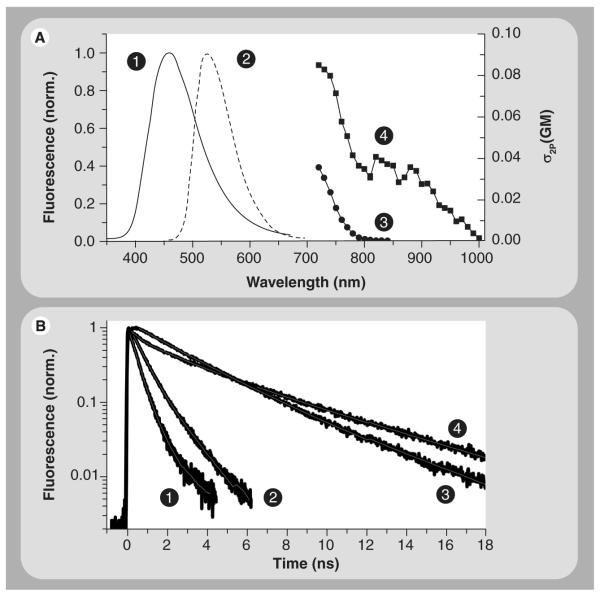
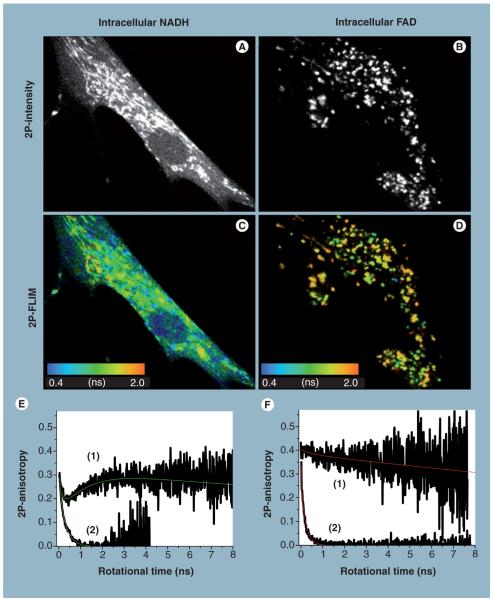
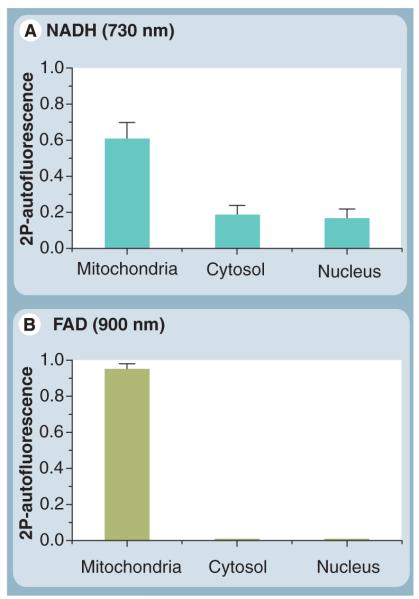
Mitochondria play a pivotal role in energy metabolism, programmed cell death and oxidative stress. Mutated mitochondrial DNA in diseased cells compromises the structure of key enzyme complexes and, therefore, mitochondrial function, which leads to a myriad of health-related conditions such as cancer, neurodegenerative diseases, diabetes and aging. Early detection of mitochondrial and metabolic anomalies is an essential step towards effective diagnoses and therapeutic intervention. Reduced nicotinamide adenine dinucleotide (NADH) and flavin adenine dinucleotide (FAD) play important roles in a wide range of cellular oxidation-reduction reactions. Importantly, NADH and FAD are naturally fluorescent, which allows noninvasive imaging of metabolic activities of living cells and tissues. Furthermore, NADH and FAD autofluorescence, which can be excited using distinct wavelengths for complementary imaging methods and is sensitive to protein binding and local environment. This article highlights recent developments concerning intracellular NADH and FAD as potential biomarkers for metabolic and mitochondrial activities.


Figures

Figure 1
Figure 1. The chemical structure of NAD(P)H, FADH2 and their oxidized forms
(A) The chemical structure of NAD(P)H is shown along with the corresponding nicotinamide ring of oxidized NAD(P)+ (right), which constitutes the reactive moiety that accepts a hydrogen ion and two electrons. (B) The chemical structure of FADH2 is also shown. The isoalloxazine ring is the reactive part of FAD (right) that is responsible for light absorption in the UV region with visible emission. Flavin mononucleotide has a similar chemical structure to FAD but it does not contain the ribose and adenine moieties (not shown). NAD(P)H and FAD are fluorescent while NAD(P)+ and FADH2 are not.FAD: Flavin adenine dinucleotide; FADH2: Reduced flavin adenine dinucleotide; NAD(P)+: Oxidized nicotinamide adenine dinucleotide phosphate; NAD(P)H: Reduced nicotinamide adenine dinucleotide phosphate.
Figure 2
Figure 2. Mitochondrial role in energy metabolism, apoptosis and oxidative stress in eukaryotic cells
In glycolysis, an alternative pathway for producing ATP under mitochondrial dysfunction, two ATP, two NAD+ and two pyruvate molecules are generated for each glucose molecule consumed via a series of ten catalyzed reactions. The high-energy electrons of glycolytic NAD+ are shuttled (via the malate–aspirate and glycerol-3-phosphate shuttles) into the mitochondria, while the final destination of the pyruvate molecules is the tricarboxylic acid cycle in the mitochondrial matrix. Oxidative phosphorylation involves a series of coupled enzyme complexes (I–IV) in the electron transport chain to generate a proton gradient across the inner mitochondrial membrane that activates the ATP synthase (complex V), which provide the majority of cellular ATP. In addition, the free electrons in the electron transport chain (especially from complex I and III) generate singlet oxygen species, which cause oxidative stress and the loss of ΔΨm in the absence of antioxidant defense mechanisms. The release of CytC from the inner mitochondrial membrane triggers apoptosis ANT: Adenine nucleotide translocator; CoQ: Coenzyme Q; CytC: Cytochrome C; FAD: Flavin adenine dinucleotide; FADH2: Reduced flavin adenine dinucleotide; IMM: Inner mitochondrial membrane; mPTP: Mitochondrial permeability transition pore; NADH: Reduced nicotinamide adenine dinucleotide; OMM: Outer mitochondrial membrane; TCA: Tricarboxylic acid; VDAC: Voltage-dependent anion channel; VDCC: Voltage-dependent calcium channel.
Figure 3
Figure 3. Fluorescence lifetime, two-photon excitation cross-section and emission spectra of NADH and FAD
(A) The one-photon-fluorescence spectrum of NADH (1) peaks at approximately 458 nm as compared with approximately 528 nm emission of FAD in a buffered solution. Two-photon-excitation crosssection spectra of NADH (3) and FAD (4) are shown in GM units (1 GM = 10−50 cm4.s.photon−1.molecule−1) [29]. These results indicate that both NADH and FAD can be excited nonlinearly using 730 nm, but only FAD can be excited when λ is approximately 850–950 nm (4). As a result, the two photon-excitation wavelength, as well as the detection filters, can be used to separate the contribution of intracellular NADH and FAD autofluorescence. (B) Time-resolved fluorescence NADH (1) and FAD (3) decays as multiexponential with distinct time constants [29,42,53] and sensitivity to protein binding (mitochondria malate dehydrogenase (2); lipoamide dehydrogenase (4)). As a result, fluorescence lifetime can be used as a contrasting observable to differentiate between these two coenzymes using fluorescence lifetime imaging techniques.FAD: Flavin adenine dinucleotide; NADH: Reduced nicotinamide adenine dinucleotide.
Figure 4
Figure 4. Two-photon autofluorescence intensity, lifetime and anisotropy of intracellular NADH and flavin in living cells
The 2P-autofluorescence intensity imaging of endogenous NADH (A) and FAD (B) in HTB125 cells were recorded using 740 and 900 nm excitations, respectively, under different magnifications to examine their distribution throughout a single cell. The corresponding 2P-autofluorescence lifetime imaging reveals that the average autofluorescence lifetime of NADH (C) is relatively faster than that of FAD (D), as shown in the color bar. Furthermore, these intensity and lifetime images indicate a heterogeneous concentration, conformation and surrounding environment of these coenzymes. Time-resolved associated anisotropy of intracellular NADH (E), curve (1), provides direct evidence of the presence of two populations of free and enzyme-bound species at equilibrium [42,53]. Associate anisotropy decays are indicative of two species with distinctive sizes and autofluorescence properties (e.g., quantum yield or lifetime). As a point of reference, the anisotropy of free NADH in a buffer exhibits simple decay (E), curve (1), with a fast rotational time. By contrast, time-resolved autofluorescence anisotropy of intracellular FAD (F), curve (1), indicates a mostly enzyme-bound with a much slower rotational time than free FAD in a buffer (F), curve (2). These combined results demonstrate the potential of an integrated experimental approach [53,157] towards conducting biochemical analyses on living cells and tissues, without the need for their destruction as required with conventional biochemical techniques. 2P: Two-photon; FAD: Flavin adenine dinucleotide; FLIM: Fluorescence lifetime imaging; NADH: Reduced nicotinamide adenine dinucleotide.
Figure 5
Figure 5. Pixel-to-pixel analysis of intracellular NADH and FAD two-photon autofluorescence intensity at the single-cell level
(A) Under 730-nm excitation, pixel-to-pixel ana lysis (binning: 3) reveals that approximately 61% of intracellular NADH is localized in mitochondria (oxidative phosphorylation and tricarboxylic acid cycle), while 19% of the population could be found in the cytoplasm (glycolysis). In addition, approximately 17% of native NADH seems to exist in the nucleus (transcriptional pathways [82]), after the background signal was subtracted from the real autofluorescence signal. (B) Intracellular flavin, however, is localized mainly in the mitochondria (>95%) when monitored at 900-nm excitation. 2P: Two-photon; FAD: Flavin adenine dinucleotide; NADH: Reduced nicotinamide adenine dinucleotide.
Figure 6
Figure 6. Multiparametric approach for noninvasive imaging of intracellular coenzymes autofluorescence in living cells or tissues
From the sample perspective, a range of physiological parameters (e.g., oxygen, glucose content, temperature, culture medium, reactive oxygen species and apoptotic agents for in vitro studies as compared with blood flow associated with in vivo imaging) has to be controlled for meaningful interpretation. The coenzyme of choice will be determined by the biological and medical hypothesis to be tested and will dictate the experimental design, such as excitation wavelength (λx), readout fluorescence (λfl) variables and information to be gained. Confocal one-photon (blue) or two-photon (red) microscopy are used to selectively excite reduced nicotinamide adenine dinucleotide (NADH) and flavin adenine dinucleotide with high spatial (x,y) and temporal resolution of their autofluorescence intensity. Spectral resolution of the autofluorescence emission, using a microscope-compatible spectrofluorimeter, can be used as a coenzyme fingerprint for their identification and protein binding state. Autofluorescence lifetime imaging enables us to assess the conformation (free vs protein bound) and environmental heterogeneity of intracellular NADH and flavin (i.e., how the cellular environment may influence their fluorescence quantum yield). In addition, these fluorescence lifetime and intensity images, recorded simultaneously on a calibrated microscope, can be used to construct concentration images of endogenous NADH and flavin at the single-cell level [53,157]. For a direct assessment of the size, conformation and environmental restriction of these coenzymes, time-resolved fluorescence anisotropy images can be used at the single-cell [53] or tissue level [42]. Simultaneous differential interference contrast imaging (not shown) also allow for monitoring changes in cell morphology.ROS: Reactive oxygen species.

Similar articles

Cited by

References

    1. Alberts B, Johnson A, Lewis J, Raff M, Roberts K, Walter P. Molecular Biology of the Cell. 4th Edition Garland Science; NY, USA: 2002.
    1. Christen Y. Oxidative stress and Alzheimer disease. Am. J. Clin. Nutr. 2000;71(2):621S–629S. - PubMed
    1. Jacquard C, Trioulier Y, Cosker F, et al. Brain mitochondrial defects amplify intracellular [Ca2+] rise and neurodegeneration but not Ca2+ entry during NMDA receptor activation. FASEB J. 2006;20(7):1021–1023. - PubMed
    1. Duchen MR. Mitochondria in health and disease: perspectives on a new mitochondrial biology. Mol. Aspects Med. 2004;25(4):365–451. ▪▪ Insightful perspective on mitochondria in health, diseases and basic biology.

    1. Duchen MR. Roles of mitochondria in health and disease. Diabetes. 2004;53(Suppl. 1):S96–S102. - PubMed

Publication types