. 2010 Sep;20(5):909-25.
doi: 10.1111/j.1750-3639.2010.00387.x. Epub 2010 Mar 9.

Microglia-derived macrophage colony stimulating factor promotes generation of proinflammatory cytokines by astrocytes in the periventricular white matter in the hypoxic neonatal brain

Affiliations

Microglia-derived macrophage colony stimulating factor promotes generation of proinflammatory cytokines by astrocytes in the periventricular white matter in the hypoxic neonatal brain

Yi Yu Deng et al. Brain Pathol. 2010 Sep.

Abstract

Inflammation in the periventricular white matter (PWM) of hypoxic neonatal brain causes myelination disturbances. In this connection, macrophage colony-stimulating factor (M-CSF) has been reported to regulate release of proinflammatory cytokines that may be linked to PWM damage. We sought to determine if M-CSF derived from amoeboid microglial cells (AMC) would promote proinflammatory cytokine production by astrocytes in the PWM following hypoxic exposure, and, if so, whether it is associated with axon degeneration and myelination disturbances. In 1-day hypoxic rats, expression of M-CSF was upregulated in AMC. This was coupled with increased expression of CSF-1 receptor, tumor necrosis factor-alpha (TNF-alpha) and interleukin-1beta (IL-1beta) in astrocytes, and TNF-receptor 1 and IL-receptor 1 on the axons. Neurofilament-200 immunopositive axons and myelin basic protein immunopositive processes appeared to undergo disruption in 14-days hypoxic rats. By electron microscopy, some axons showed degenerative changes affecting the microtubules and myelin sheath. Primary cultured microglial cells subjected to hypoxia showed enhanced release of M-CSF. Remarkably, primary cultured astrocytes treated with conditioned-medium derived from hypoxic microglia or M-CSF exhibited increased production of TNF-alpha and IL-1beta. Our results suggest that AMC-derived M-CSF promotes astrocytes to generate proinflammatory cytokines, which may be involved in axonal damage following a hypoxic insult.


Figures
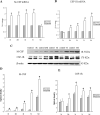
Figure 1
Figure 1
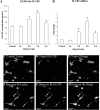
M‐CSF, CSF‐1R mRNA and protein expression in the PWM at 3, 24 h, 3, 7 and 14 days after hypoxic exposure and corresponding control rats. Panels A and B show the graphical representation of the fold changes in M‐CSF and CSF‐1R mRNA, respectively, as quantified by normalization to the β‐actin as an internal control. Panel C shows M‐CSF (18.5 kDa), CSF‐1R (170 kDa) and β‐actin (42 kDa) immunoreactive bands, respectively. Panels DE show bar graphs depicting significant changes in the optical density of M‐CSF and CSF‐1R, respectively, following hypoxic exposure when compared with their corresponding controls. Significant difference in mRNA and protein levels in the PWM after the hypoxic exposure is evident when compared with controls. *P < 0.05. Abbreviations: M‐CSF = macrophage colony‐stimulating factor; PWM = periventricular white matter.
Figure 2
Figure 2
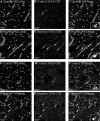
Confocal images showing the distribution of lectin labeled (A,D,G,J, green), and M‐CSF (B,E,H,K red) immunoreactive amoeboid microglial cells (AMC; arrows) in the PWM at 3 and 7 days after the hypoxic exposure and in the corresponding control rat. The co‐localized expression of lectin and M‐CSF in AMC can be seen in C, F, I and L. Note M‐CSF expression in AMC (arrows) is markedly enhanced after the hypoxic exposure. Scale bars: A–L, 50 µm. Abbreviations: M‐CSF =  macrophage colony‐stimulating factor; AMC = amoeboid microglial cells.
Figure 3
Figure 3
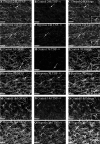
Confocal images showing the distribution of GFAP‐labeled (A,D,G,J, green), and CSF‐1R (B,E,H,K red) immunoreactive astrocytes (arrows) in the PWM at 7 and 14 days after the hypoxic exposure and the corresponding control rats. The colocalized expression of GFAP and CSF‐1R astrocytes can be seen in C, F, I and L. Note CSF‐1R expression in astrocytes (arrows) is markedly enhanced after the hypoxic exposure. Scale bars: A–L, 20 µm. Abbreviations: GFAP = glial fibrillary acidic protein; CSF = colony‐stimulating factor; PWM = periventricular white matter.
Figure 4
Figure 4
Confocal images showing the distribution of GFAP‐labeled (A,D,G,J,M,P, green), and TNF‐α (B,E,H,K,N,Q, red) immunoreactive astrocytes (arrows) in the PWM at 24 h, 7 and 14 days after the hypoxic exposure and the corresponding control rats. The co‐localized expression of GFAP and TNF‐α astrocytes can be seen in panels C, F, I, L, O and R. Note TNF‐α expression in astrocytes (arrows) is markedly enhanced at 7 and 14 days after the hypoxic exposure. Scale bars: A–R, 20 µm. Abbreviations: GFAP = glial fibrillary acidic protein; PWM =  periventricular white matter.
Figure 5
Figure 5
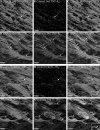
Confocal images showing the distribution of NF‐200 (A,D,G,J, green), TNF‐R1 (B,E red) and IL‐1R1 (H,K red) in axons (arrows) in the PWM at 14 days after the hypoxic exposure and the corresponding control. Co‐localized expression of NF‐200 with TNF‐R1 and IL‐1R1 is depicted in panels C and F, I and L. Note the expression of TNF‐R1 and IL‐1R1 is upregulated after the hypoxic exposure. Scale bars: A–L, 20 µm. Abbreviation: PWM = periventricular white matter.
Figure 6
Figure 6
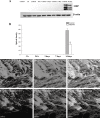
MBP and NF‐200 protein expression in the PWM at 14 days after the hypoxic exposure and the corresponding control rats. A shows MBP and β‐actin (42 KDa) immunoreactive bands, respectively. Bar graph in B shows significant decrease in the optical density of MBP following hypoxic exposure when compared with the corresponding controls (*P < 0.01). Confocal images showing the expression of MBP (C, green), NF‐200 (D, red), and co‐localized expression of MBP and NF‐200 (E) in the PWM at 14 days of control rats. F–H show the expression of MBP (F, green), NF‐200 (G, red), and co‐localized expression of MBP and NF‐200 (H) at 14 days after the hypoxic exposure. Note the MBP positive processes and NF‐200 positive axons are disrupted following the hypoxic exposure (F,G) as compared with the control (C,D). Scale bars: C–H, 50 µm. Abbreviation: PWM = periventricular white matter.
Figure 7
Figure 7
M‐CSF mRNA and protein expression in cultured microglia in the controls and at 1, 2, 4 and 6 h after hypoxic exposure. Bar graph in panel A shows that release of M‐CSF is significantly increased in the medium at 2, 4, and 6 h after hypoxic exposure. Bar graphs in panel B show changes in M‐CSF mRNA expression. Significant differences in mRNA and protein levels in hypoxic microglial cells are evident when compared with controls (*P < 0.05). Confocal images of cultured control microglia showing the expression of lectin (C, green), M‐CSF (D, red) and co‐localized expression of lectin and M‐CSF (E). F‐H show the expression of lectin (F, green), M‐CSF (G, red) and co‐localized expression of lectin and M‐CSF (H) after treatment with 3% oxygen for 4 h. Note the elevated expression of M‐CSF at 4 h after hypoxic exposure (G) as compared with the control cells (D). *P < 0.01. Scale bars: C–H, 50 µm. Abbreviation: M‐CSF = macrophage colony‐stimulating factor.
Figure 8
Figure 8
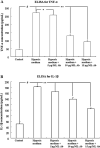
ELISA analysis shows release of TNF‐α and IL‐1β protein from astrocytes after treatment with microglia conditioned medium for 3 h in the neutralization test. Bar graph A shows that conditioned medium triggered release of TNF‐α is significantly increased and is neutralized with M‐CSF antibody in doses of 5, 10 and 15 µg/mL. Bar graph B shows that conditioned medium triggered release of IL‐1β is significantly increased and is neutralized with M‐CSF antibody in doses of 5, 10 and 15 µg/mL. # indicates significant differences between the control and astrocytes treated with conditioned medium. * or ** indicated significant differences between astrocytes treated with conditioned medium alone and neutralized with M‐CSF antibody. **P < 0.01, *P < 0.05, #P < 0.01. Abbreviation: M‐CSF = macrophage colony‐stimulating factor.
Figure 9
Figure 9
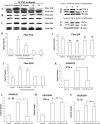
Western blot analysis showing M‐CSF induced TNF‐α and IL‐1β production via activation of MAPK pathway in astrocytes. Panels A, B and C show JNK, p38, ERK phosphorylation and total JNK, p38, ERK immunoreactive bands. Panels D and E show immunoreactive bands which indicate that SP600125 (a JNK inhibitor) suppress the expression of TNF‐α and IL‐1β, respectively, in the astrocytes after M‐CSF treatment for 3 h. Panels F and G show immunoreactive bands, which indicate that SB203580 (a p38 inhibitor) cannot suppress the expression of TNF‐α and IL‐1β, respectively, in the astrocytes after M‐CSF treatment for 3 h. Panels H and J are bar graphs showing significant changes in the optical density of JNK and ERK phosphorylation, respectively, following treatment with M‐CSF. Panels I is a bar graph showing no significant changes in the optical density of p38 phosphorylation following treatment with M‐CSF. Panels KL are bar graphs showing significant suppression in expression of TNF‐α and IL‐1β by SP600125, respectively. Panels MN are bar graphs showing no significant suppression in expression of TNF‐α and IL‐1β by SB203580, respectively. *P < 0.05, ns: P > 0.05. Abbreviation: M‐CSF = macrophage colony‐stimulating factor.

Similar articles

Cited by

References

    1. Barres BA, Raff MC (1993) Proliferation of oligodendrocyte precursor cells depends on electrical activity in axons. Nature 361:258–260. - PubMed
    1. Billiards SS, Haynes RL, Folkerth RD, Trachtenberg FL, Liu LG, Volpe JJ, Kinney HC (2006) Development of microglia in the cerebral white matter of the human fetus and infant. J Comp Neurol 497:199–208. - PubMed
    1. Bradford MM (1976) A rapid and sensitive method for the quantitation of microgram quantities of protein utilizing the principle of protein‐dye binding. Anal Biochem 72:248–254. - PubMed
    1. Cecchini MG, Dominguez MG, Mocci S, Wetterwald A, Felix R, Fleisch H et al (1994) Role of colony stimulating factor‐1 in the establishment and regulation of tissue macrophages during postnatal development of the mouse. Development 120:1357–1372. - PubMed
    1. Chew LJ, Takanohashi A, Bell M (2006) Microglia and inflammation: impact on developmental brain injuries. Ment Retard Dev Disabil Res Rev 12:105–112. - PubMed

Publication types

MeSH terms