. 2011 Apr;15(4):874-87.
doi: 10.1111/j.1582-4934.2010.01067.x.

In vivo imaging of CT26 mouse tumours by using cmHsp70.1 monoclonal antibody

Affiliations

In vivo imaging of CT26 mouse tumours by using cmHsp70.1 monoclonal antibody

Stefan Stangl et al. J Cell Mol Med. 2011 Apr.

Abstract

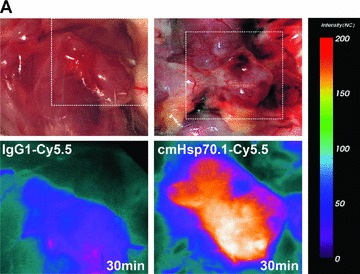
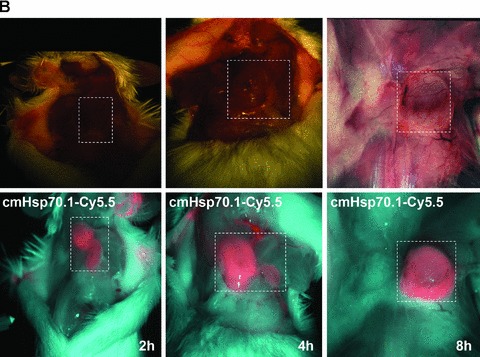
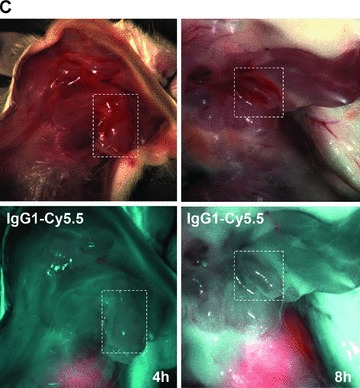
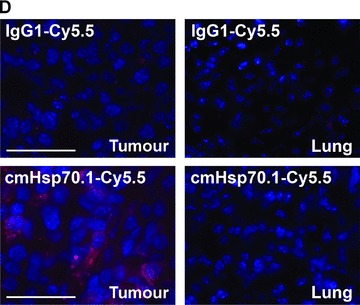
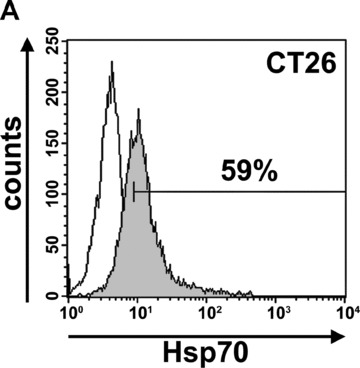
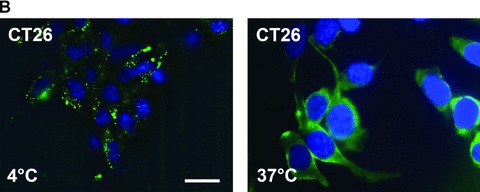
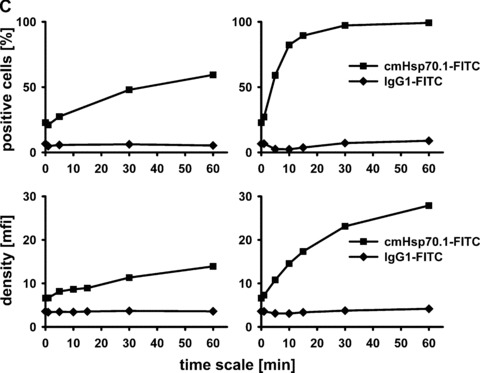
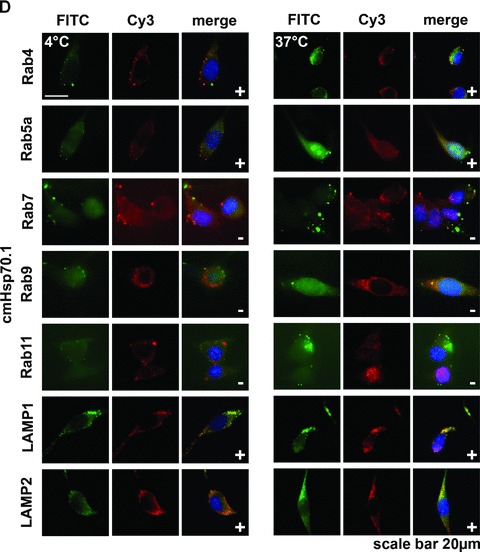
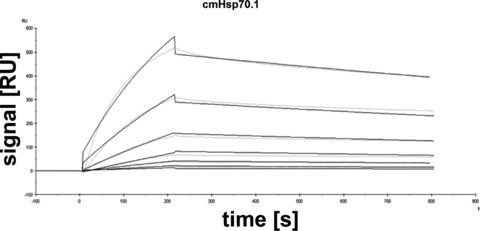
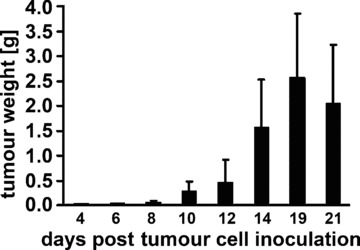
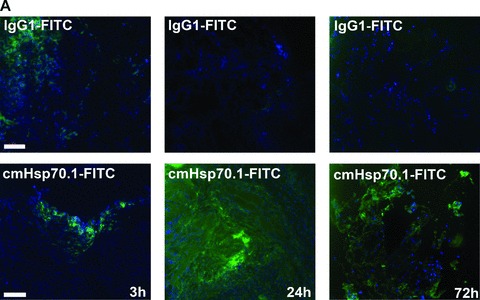
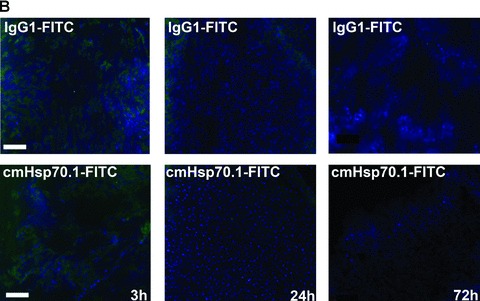
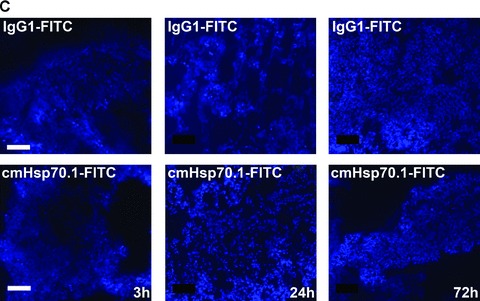
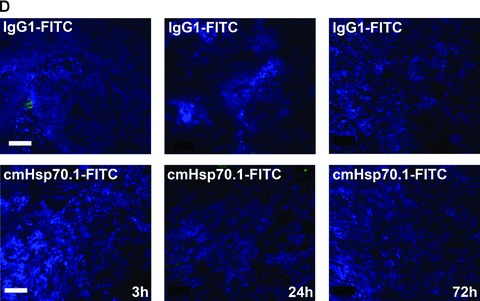
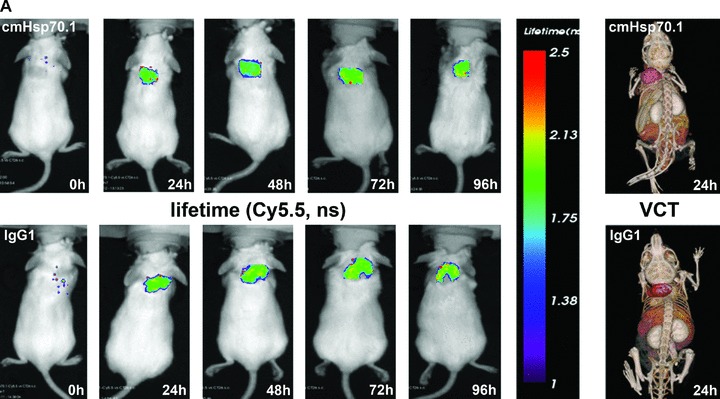
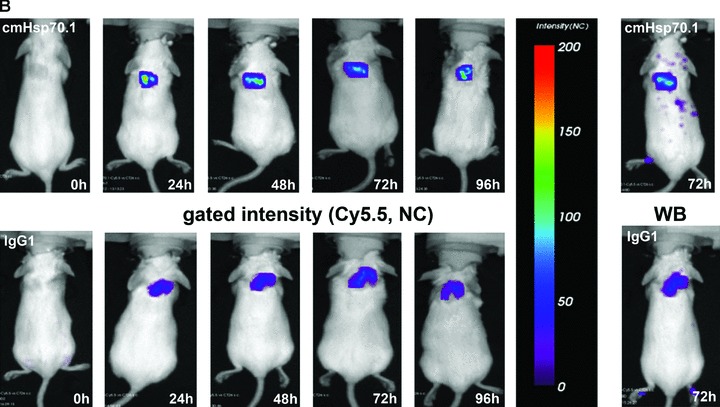
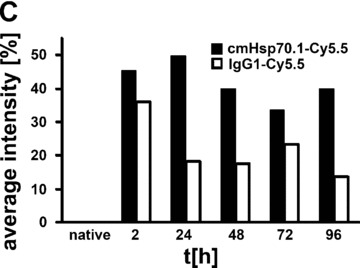
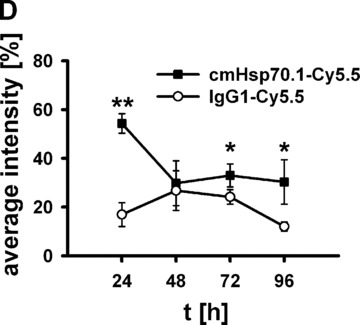
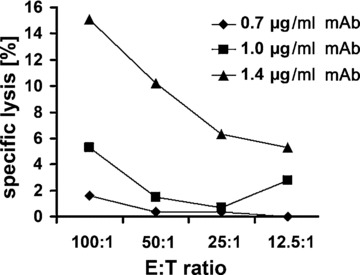
The major stress-inducible heat shock protein 70 (Hsp70) is frequently present on the cell surface of human tumours, but not on normal cells. Herein, the binding characteristics of the cmHsp70.1 mouse monoclonal antibody (mAb) were evaluated in vitro and in a syngeneic tumour mouse model. More than 50% of the CT26 mouse colon carcinoma cells express Hsp70 on their cell surface at 4°C. After a temperature shift to 37°C, the cmHsp70.1-fluorescein isothiocyanate mAb translocates into early endosomes and lysosomes. Intraoperative and near-infrared fluorescence imaging revealed an enrichment of Cy5.5-conjugated mAb cmHsp70.1, but not an identically labelled IgG1 isotype-matched control, in i.p. and s.c. located CT26 tumours, as soon as 30 min. after i.v. injection into the tail vein. Due to the rapid turnover rate of membrane-bound Hsp70, the fluorescence-labelled cmHsp70.1 mAb became endocytosed and accumulated in the tumour, reaching a maximum after 24 hrs and remained detectable at least up to 96 hrs after a single i.v. injection. The tumour-selective internalization of mAb cmHsp70.1 at the physiological temperature of 37°C might enable a targeted uptake of toxins or radionuclides into Hsp70 membrane-positive tumours. The anti-tumoral activity of the cmHsp70.1 mAb is further supported by its capacity to mediate antibody-dependent cytotoxicity.


Figures

Fig 4
Fig 4
(A) Optical imaging. Intraoperative detection of cmHsp70.1-Cy5.5 mAb in tumour-bearing BALB/c mice. 100 μg of cmHsp70.1-Cy5.5 mAb as well as the IgG1-Cy5.5 control were injected i.v. into the tail vein of CT26 tumour-bearing mice on day 14. Representative views of the Cy5.5 fluorescence and autopsy images of the dorsal part of the mice were taken 30 min. after i.v. injection of the antibodies. Upper panel, autopsy image of the dorsal located mouse tumour in true colours. Lower panel, false colour images of the Cy5.5 staining within the tumour. The massive fluorescence signal corresponds to the anatomic position of the CT26 tumour which is stained with cmHsp70.1-Cy5.5 mAb. Almost no staining with an equivalently labelled IgG1 isotype-matched control is detectable. (B) Kinetics of the intraoperative detection of cmHsp70.1-Cy5.5 mAb in CT26 tumour-bearing mice on day 14. Representative views of the Cy5.5 fluorescence images of the dorsal part of the mice were taken 2, 4 and 8 hrs after i.v. injection of the antibody. Upper panel, autopsy images of the dorsal located mouse tumour in true colours. Lower panel, false colour images of the Cy5.5 staining within the tumour indicated in red. (C) Kinetics of the intraoperative detection of IgG1-Cy5.5 control immunoglobulin in CT26 tumour-bearing mice on day 14. Representative views of the Cy5.5 fluorescence images of the ventral part of the mice were taken 4 and 8 hrs after i.v. injection of the antibody. Upper panel, autopsy images of the ventral located mouse tumour in true colours. Lower panel, false colour images of the Cy5.5 staining indicated in red. No staining was detectable within the tumour following the administration of the IgG1-Cy5.5 isotype-matched control. (D) Immunofluorescence studies of tumour and normal tissue (lung) sections (10 μm) derived from the same animals, 8 hrs after i.v. injection of IgG1-Cy5.5 (upper panel) or cmHsp70.1-Cy5.5 mAb (lower panel). The nuclei are visualized in blue (DAPI) and the localization of Hsp70 is visualized in red (Cy5.5). The scale bar represents 50 μm.
Fig 4
Fig 4
(A) Optical imaging. Intraoperative detection of cmHsp70.1-Cy5.5 mAb in tumour-bearing BALB/c mice. 100 μg of cmHsp70.1-Cy5.5 mAb as well as the IgG1-Cy5.5 control were injected i.v. into the tail vein of CT26 tumour-bearing mice on day 14. Representative views of the Cy5.5 fluorescence and autopsy images of the dorsal part of the mice were taken 30 min. after i.v. injection of the antibodies. Upper panel, autopsy image of the dorsal located mouse tumour in true colours. Lower panel, false colour images of the Cy5.5 staining within the tumour. The massive fluorescence signal corresponds to the anatomic position of the CT26 tumour which is stained with cmHsp70.1-Cy5.5 mAb. Almost no staining with an equivalently labelled IgG1 isotype-matched control is detectable. (B) Kinetics of the intraoperative detection of cmHsp70.1-Cy5.5 mAb in CT26 tumour-bearing mice on day 14. Representative views of the Cy5.5 fluorescence images of the dorsal part of the mice were taken 2, 4 and 8 hrs after i.v. injection of the antibody. Upper panel, autopsy images of the dorsal located mouse tumour in true colours. Lower panel, false colour images of the Cy5.5 staining within the tumour indicated in red. (C) Kinetics of the intraoperative detection of IgG1-Cy5.5 control immunoglobulin in CT26 tumour-bearing mice on day 14. Representative views of the Cy5.5 fluorescence images of the ventral part of the mice were taken 4 and 8 hrs after i.v. injection of the antibody. Upper panel, autopsy images of the ventral located mouse tumour in true colours. Lower panel, false colour images of the Cy5.5 staining indicated in red. No staining was detectable within the tumour following the administration of the IgG1-Cy5.5 isotype-matched control. (D) Immunofluorescence studies of tumour and normal tissue (lung) sections (10 μm) derived from the same animals, 8 hrs after i.v. injection of IgG1-Cy5.5 (upper panel) or cmHsp70.1-Cy5.5 mAb (lower panel). The nuclei are visualized in blue (DAPI) and the localization of Hsp70 is visualized in red (Cy5.5). The scale bar represents 50 μm.
Fig 1
Fig 1
(A) Flow cytometric analysis. Representative view of the Hsp70 cell surface expression on CT26 mouse colon carcinoma cells after flow cytometric analysis using the cmHsp70.1-FITC conjugated mAb. Results are expressed as log green fluorescence intensity versus relative cell numbers. The IgG1 isotype-matched control is indicated in white and membrane Hsp70+ population is shown in grey. Only viable (propidium-iodide negative) cells were gated and analysed. (B) Representative immunofluorescence images of CT26 tumour cells stained with cmHsp70.1-FITC mAb at 4°C (cell surface staining; left), or following a temperature shift to 37°C for 15 min. (cytosolic staining; right). The scale bar represents 20 μm. (C) Representative views of the kinetics of cmHsp70.1-FITC mAb uptake into CT26 tumour cells. Tumour cells were washed and analysed by flow cytometry following incubation with cmHsp70.1-FITC mAb or IgG1-FITC for 2, 5, 10, 15, 30 and 60 min. cells at 4°C (left panel) and 37°C (right panel). The upper graphs indicate the percentage of positively stained cells the lower graphs indicate the antigen densities at the indicated time-points, expressed as the mfi. The increase in the proportion of membrane Hsp70+ cells and in the mfi was significant (P < 0.05) at 37°C but not at 4°C. (D) Representative immunofluorescence images of CT26 tumour cells either stained with cmHsp70.1-FITC (green, first row) or with Cy3-secondary antibody labelled (red, second row) Rab4 (early endosome), Rab5a (early endosome), Rab7 (late endosome), Rab9 (late endosome), Rab11 (trans golgi network, recycling endosome), LAMP1 (CD107, lysosome), LAMP2 (lysosome) antibodies at 4°C (left three rows) and after an incubation of 30 min. at 37°C (right three rows). A co-localization of the FITC (green) and Cy3 (red) fluorescence, as indicated in a yellow spectrum (third row), is marked with ‘+’ in the merged fluorescence staining pattern. Isotype-matched control antibodies did not show any staining (data not shown). Similar results were obtained in three independent experiments. The scale bar represents 20 μm.
Fig 1
Fig 1
(A) Flow cytometric analysis. Representative view of the Hsp70 cell surface expression on CT26 mouse colon carcinoma cells after flow cytometric analysis using the cmHsp70.1-FITC conjugated mAb. Results are expressed as log green fluorescence intensity versus relative cell numbers. The IgG1 isotype-matched control is indicated in white and membrane Hsp70+ population is shown in grey. Only viable (propidium-iodide negative) cells were gated and analysed. (B) Representative immunofluorescence images of CT26 tumour cells stained with cmHsp70.1-FITC mAb at 4°C (cell surface staining; left), or following a temperature shift to 37°C for 15 min. (cytosolic staining; right). The scale bar represents 20 μm. (C) Representative views of the kinetics of cmHsp70.1-FITC mAb uptake into CT26 tumour cells. Tumour cells were washed and analysed by flow cytometry following incubation with cmHsp70.1-FITC mAb or IgG1-FITC for 2, 5, 10, 15, 30 and 60 min. cells at 4°C (left panel) and 37°C (right panel). The upper graphs indicate the percentage of positively stained cells the lower graphs indicate the antigen densities at the indicated time-points, expressed as the mfi. The increase in the proportion of membrane Hsp70+ cells and in the mfi was significant (P < 0.05) at 37°C but not at 4°C. (D) Representative immunofluorescence images of CT26 tumour cells either stained with cmHsp70.1-FITC (green, first row) or with Cy3-secondary antibody labelled (red, second row) Rab4 (early endosome), Rab5a (early endosome), Rab7 (late endosome), Rab9 (late endosome), Rab11 (trans golgi network, recycling endosome), LAMP1 (CD107, lysosome), LAMP2 (lysosome) antibodies at 4°C (left three rows) and after an incubation of 30 min. at 37°C (right three rows). A co-localization of the FITC (green) and Cy3 (red) fluorescence, as indicated in a yellow spectrum (third row), is marked with ‘+’ in the merged fluorescence staining pattern. Isotype-matched control antibodies did not show any staining (data not shown). Similar results were obtained in three independent experiments. The scale bar represents 20 μm.
Fig 2
Fig 2
Global kinetic analysis of cmHsp70.1 mAb binding human Hsp70 using a Biacore. Purified human Hsp70 protein was diluted to final concentrations of 0.78, 1.6, 3.1, 6.3, 12.5, 25, 50 nM and injected onto a cmHsp70.1 mAb-coated gold surface. Relative response units were analysed using BIAevaluation software 4.1. Kinetic constants were Kon= 6.99 × 10⁴/M/s, Koff= 3.79 × 10⁻⁴/s and a KD= 5.4 nM with a ×2= 59.4, respectively. Grey coloured lines contrast the measured data from the simulated fits (black).
Fig 3
Fig 3
Tumour growth curve for CT26 colon adenocarcinoma cells in BALB/c mice. Following i.p. injection of tumour cells (2.5 × 10⁴) mice were killed on days 4 (0.03 ± 0.11 g; n= 3), 6 (0.05 ± 0.2 g; n= 3), 8 (0.05 ± 0.03 g; n= 5), 10 (0.29 ± 0.2 g; n= 7), 12 (0.47 ± 0.44 g; n= 7), 14 (1.55 ± 0.9 g; n= 35), 19 (2.6 ± 1.3 g; n= 17), 21 (2.05 ± 1.18 g; n= 10) and tumour weights were determined.
Fig 5
Fig 5
Immunofluorescence analysis of tumour and normal tissue sections. cmHsp70.1-FITC mAb (lower panel) or the identically labelled IgG1 control (upper panel, 100 μg each) was injected into the tail veins of tumour-bearing mice on day 14 after i.p. tumour cell (CT26) injection. Animals were killed 3, 24 and 72 hrs thereafter and the tumour (A), liver (B), lung (C) and kidney (D) were cryo-conserved. Representative views of sections (5 μm) of the tumours and organs were taken at the indicated time-points after the injection of the IgG1-FITC (upper panel) and cmHsp70.1-FITC mAb (lower panel). The nuclei are stained in blue (DAPI) and the localization of Hsp70 is visualized in green (FITC). The scale bar represents 100 μm.
Fig 5
Fig 5
Immunofluorescence analysis of tumour and normal tissue sections. cmHsp70.1-FITC mAb (lower panel) or the identically labelled IgG1 control (upper panel, 100 μg each) was injected into the tail veins of tumour-bearing mice on day 14 after i.p. tumour cell (CT26) injection. Animals were killed 3, 24 and 72 hrs thereafter and the tumour (A), liver (B), lung (C) and kidney (D) were cryo-conserved. Representative views of sections (5 μm) of the tumours and organs were taken at the indicated time-points after the injection of the IgG1-FITC (upper panel) and cmHsp70.1-FITC mAb (lower panel). The nuclei are stained in blue (DAPI) and the localization of Hsp70 is visualized in green (FITC). The scale bar represents 100 μm.
Fig 6
Fig 6
(A) Lifetime images and flat-panel VCT scans. Representative lifetime images were obtained using the Optix system. Representative fluorescence signals over the s.c. located CT26 tumour regions show lifetimes of 1.7 nsec., which are characteristic for Cy5.5-conjugated cmHsp70.1 mAb (upper panel) and the IgG1 (lower panel) isotype-matched control. Images were taken 0, 24, 48, 72 and 96 hrs after i.v. injection into the tail vein. The peak emission of Cy5.5 is at 694 nm in the bright green area. Localization of the CT26 colon adenocarcinoma in the dorsal neck region of the mice is depicted in the volume rendered flat-panel VCT scans which were taken 24 hrs after the injection of the cmHsp70.1 mAb and isotype-matched control on days 14, 15, 16 and 17 after the tumour cell injection. On day 14, the tumour size which was determined by flat-panel VCT, was 0.227 cm3 in mice injected with cmHsp70.1 mAb, and 0.211 cm3, in mice injected with the IgG1 control antibody. (B) Representative fluorescence intensity images obtained by the Optix system. Fluorescence intensity is displayed in normalized counts and is presented from two CT26 tumour-bearing mice 0, 24, 48, 72 and 96 hrs after i.v. injection of the cmHsp70.1-Cy5.5 mAb (upper panel) and an identically labelled IgG1 isotype-matched control (lower panel). Strong fluorescence signals (red outline) over the tumour of the mouse that had received the cmHsp70.1-Cy5.5 mAb, but not over the tumour in the animal that had been injected with the IgG1-Cy5.5 control were visible between 24 and 96 hrs. Whole body scans of the identical mice 72 hrs after injection of the mAb and isotype control are shown on the outer right part of the graph. Fluorescence signals were only apparent over the tumour region. (C) Quantitative analysis of the fluorescence intensity images of the tumours of mice that received either cmHsp70.1-Cy5.5 mAb (black bars) or IgG1-Cy5.5 (white bars). Average intensities of fluorescence signals in the s.c. tumour regions of the two mice shown in (B) at the indicated time-points 0, 24, 48, 72 and 96 hrs after i.v. injection of the antibodies are displayed. The data were corrected for their labelling intensities. (D) Kinetics of average fluorescence intensity of cmHsp70.1-Cy5.5 mAb (black dots) and IgG1-Cy5.5 control (white dots) in tumour-bearing mice. The data represent a summary of the average fluorescence intensity over tumour regions in mice at 24, 48, 72 and 96 hrs after i.v. injection of the antibodies. Data represent mean values of five animals; * marks values P < 0.05; ** marks values P < 0.001.
Fig 6
Fig 6
(A) Lifetime images and flat-panel VCT scans. Representative lifetime images were obtained using the Optix system. Representative fluorescence signals over the s.c. located CT26 tumour regions show lifetimes of 1.7 nsec., which are characteristic for Cy5.5-conjugated cmHsp70.1 mAb (upper panel) and the IgG1 (lower panel) isotype-matched control. Images were taken 0, 24, 48, 72 and 96 hrs after i.v. injection into the tail vein. The peak emission of Cy5.5 is at 694 nm in the bright green area. Localization of the CT26 colon adenocarcinoma in the dorsal neck region of the mice is depicted in the volume rendered flat-panel VCT scans which were taken 24 hrs after the injection of the cmHsp70.1 mAb and isotype-matched control on days 14, 15, 16 and 17 after the tumour cell injection. On day 14, the tumour size which was determined by flat-panel VCT, was 0.227 cm3 in mice injected with cmHsp70.1 mAb, and 0.211 cm3, in mice injected with the IgG1 control antibody. (B) Representative fluorescence intensity images obtained by the Optix system. Fluorescence intensity is displayed in normalized counts and is presented from two CT26 tumour-bearing mice 0, 24, 48, 72 and 96 hrs after i.v. injection of the cmHsp70.1-Cy5.5 mAb (upper panel) and an identically labelled IgG1 isotype-matched control (lower panel). Strong fluorescence signals (red outline) over the tumour of the mouse that had received the cmHsp70.1-Cy5.5 mAb, but not over the tumour in the animal that had been injected with the IgG1-Cy5.5 control were visible between 24 and 96 hrs. Whole body scans of the identical mice 72 hrs after injection of the mAb and isotype control are shown on the outer right part of the graph. Fluorescence signals were only apparent over the tumour region. (C) Quantitative analysis of the fluorescence intensity images of the tumours of mice that received either cmHsp70.1-Cy5.5 mAb (black bars) or IgG1-Cy5.5 (white bars). Average intensities of fluorescence signals in the s.c. tumour regions of the two mice shown in (B) at the indicated time-points 0, 24, 48, 72 and 96 hrs after i.v. injection of the antibodies are displayed. The data were corrected for their labelling intensities. (D) Kinetics of average fluorescence intensity of cmHsp70.1-Cy5.5 mAb (black dots) and IgG1-Cy5.5 control (white dots) in tumour-bearing mice. The data represent a summary of the average fluorescence intensity over tumour regions in mice at 24, 48, 72 and 96 hrs after i.v. injection of the antibodies. Data represent mean values of five animals; * marks values P < 0.05; ** marks values P < 0.001.
Fig 7
Fig 7
Capacity of cmHsp70.1 mAb to induce ADCC against CT26 tumour cells in vitro. In vitro ADCC of CT26 colon (containing 55% Hsp70 membrane-positive cells) carcinoma cells, using 0.7, 1 and 1.4 μg/ml cmHsp70.1 mAb and unstimulated mouse spleen cells at E:T ratios ranging from 100:1 to 12.5:1. The data show one representative experiment out of three independent experiments showing similar results.

Similar articles

Cited by

References

    1. Kampinga HH, Hagemann J, Vos MJ, et al. Guidelines for the nomenclature of the human heat shock proteins. Cell Stress Chaperones. 2009;14:105–11. - PMC - PubMed
    1. Ferrarini M, Heltai S, Zocchi MR, et al. Unusual expression and localization of heat-shock proteins in human tumor cells. Int J Cancer. 1992;51:613–9. - PubMed
    1. Shin BK, Wang H, Yim AM, et al. Global profiling of the cell surface proteome of cancer cells uncovers an abundance of proteins with chaperone function. J Biol Chem. 2003;278:7607–16. - PubMed
    1. Multhoff G, Botzler C, Wiesnet M, et al. A stress-inducible 72-kDa heat-shock protein (HSP72) is expressed on the surface of human tumor cells, but not on normal cells. Int J Cancer. 1995;61:272–9. - PubMed
    1. Botzler C, Li G, Issels RD, et al. Definition of extracellular localized epitopes of Hsp70 involved in an NK immune response. Cell Stress Chaperones. 1998;3:6–11. - PMC - PubMed

Publication types

MeSH terms

Substances