. 2010 Jul 1;11(7):886-98.
doi: 10.1111/j.1600-0854.2010.01072.x. Epub 2010 Apr 16.

Differential subcellular distributions and trafficking functions of hnRNP A2/B1 spliceoforms

Affiliations

Differential subcellular distributions and trafficking functions of hnRNP A2/B1 spliceoforms

Siew Ping Han et al. Traffic. .

Abstract

Trafficking of mRNA molecules from the nucleus to distal processes in neural cells is mediated by heterogeneous nuclear ribonucleoprotein (hnRNP) A2/B1 trans-acting factors. Although hnRNP A2/B1 is alternatively spliced to generate four isoforms, most functional studies have not distinguished between these isoforms. Here, we show, using isoform-specific antibodies and isoform-specific green fluorescent protein (GFP)-fusion expression constructs, that A2b is the predominant cytoplasmic isoform in neural cells, suggesting that it may play a key role in mRNA trafficking. The differential subcellular distribution patterns of the individual isoforms are determined by the presence or absence of alternative exons that also affect their dynamic behavior in different cellular compartments, as measured by fluorescence correlation spectroscopy. Expression of A2b is also differentially regulated with age, species and cellular development. Furthermore, coinjection of isoform-specific antibodies and labeled RNA into live oligodendrocytes shows that the assembly of RNA granules is impaired by blockade of A2b function. These findings suggest that neural cells modulate mRNA trafficking by regulating alternative splicing of hnRNP A2/B1 and controlling expression levels of A2b, which may be the predominant mediator of cytoplasmic-trafficking functions. These findings highlight the importance of considering isoform-specific functions for alternatively spliced proteins.


Figures

Figure 1
Figure 1. Differential intracellular distribution of endogenous hnRNP A2/B1 isoforms
(A) Diagram of alternatively spliced A2/B1 isoforms and epitopes recognised by antibodies used in this study. Dark blue segments represent spliced exons 2 and 9. Black bars represent locations of epitopes and dashed boxes span isoforms that are detected by each antibody. (B) Differentiated hippocampal progenitor cells, B104, oligodendrocyte, HeLa and SH-SY5Y cells were immunostained with antibodies recognizing A2/B1 (all isoforms), exon 8/10 (A2b and B1b) or exon 9 (A2 and B1). In rat cells, processes were stained by anti-A2/B1 and anti-exon 8/10, but not anti-exon 9. In human cells, both anti-A2/B1 and anti-exon 9 staining were restricted to nuclei, and there was no staining for anti-exon 8/10.
Figure 2
Figure 2. Differential intracellular and intranuclear distribution of exogenous A2/B1-GFP fusion proteins in cells
Cells were transfected with pEGFP-N1 or A2/B1-GFP fusions and immunostained for GFP (red) 24 hours post-transfection. For hippocampal progenitor (A) and B104 cells (B), arrows point to cells which have been magnified in the insets. Inset cells transfected with pEGFP, A2b-GFP and B1b-GFP expressed GFP in processes, whereas GFP expression was present only in the nucleus in cells transfected with A2-GFP and B1-GFP. The proportions of cells with process staining were quantified by a blinded observer. The data from 6 sets of transfections for each cell type were transformed for statistical analysis and transformed back to the original units for the graphs. Bars represent standard deviations. §§ p<0.0001, § p<0.05 between groups by single factor ANOVA, * p<0.05 vs. A2-GFP by Least Significant Difference method. C) In HeLa cells, while pEGFP was expressed throughout the cell, all GFP fusion proteins were localised to the nucleus. In addition, A2b-GFP exhibited a unique distribution pattern in some cells. Arrowheads and arrows indicate localisation of A2b-GFP at the nuclear envelope, and other isoforms around nucleoli, respectively. These observations were consistent over 4 sets of transfections. D) In SH-SY5Y cells, while pEGFP was expressed in processes, A2b-GFP was completely localised to the nucleus. These observations were consistent over 4 sets of transfections.
Figure 3
Figure 3. Dynamics of A2/B1-GFP fusion proteins in B104 cells
B104 cells were microinjected with vectors expressing A2/B1-GFP, and fluorescence correlation spectroscopy was used to determine the proportions of freely diffusing, slow and immobile components for each of the A2/B1 isoforms in different cells. A) FCS measurements made with the observation volume positioned in the nucleus; B) FCS measurements made with the observation volume positioned in the cytoplasm. C) Cytoplasm/nuclear partition coefficients ([C]/[N]) for different A2/B1 isoforms determined from FCS data. Bars represent standard errors. §§ p<0.001, § p<0.05 between groups by single factor ANOVA, * p<0.05 vs A2-GFP by Least Significant Difference method. D) Representative images of transfected cells.
Figure 4
Figure 4. Localisation of exon 2 and 9
HeLa cells were transfected with pEGFP or mGFP constructs and fixed 24h post-transfection. Cells transfected with A2ex2-mGFP, A2ex9-mGFP and A2M9-mGFP appeared to have more nuclear localisation of GFP than cells transfected with pEGFP-N1. There was no obvious difference between the localisation pattern of A2ex2-mGFP and A2ex2scr-mGFP, whereas A2ex9mut-mGFP may have less nuclear localisation of GFP than A2ex9-mGFP. The profiles below each image were obtained by scanning along paths marked by the dotted lines, with the vertical coloured lines corresponding to the coloured dots on the images.
Figure 5
Figure 5. hnRNP A2/B1 localisation in processes and nuclei is dependent on RNA integrity
Differentiated hippocampal cells were extracted with detergent (0.2% Triton X-100 in PBS for 10 minutes total) with or without RNase treatment. Pyronin Y staining was used to monitor the extent of RNA degradation. Cells were immunostained for A2/B1 and tubulin, which allowed visualization of the length and extent of processes. Arrows indicate A2/B1-positive granules present in detergent-extracted cells. Images were taken at the same exposure settings and processed identically for each horizontal panel.
Figure 6
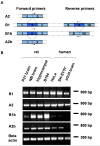
Figure 6. Expression of hnRNP A2/B1 transcripts at different developmental stages and in different cell types
A) Diagram illustrating isoform-specific primers used for RT-PCR. B) RT-PCR of P21 and NB whole brain lysate and hippocampal progenitor, B104, HeLa and SH-SY5Y whole cell lysate for hnRNP A2/B1 transcripts. PCR was also performed on human brain cDNA. β-actin was used as a loading control. A2b and B1b transcripts are present at lower amounts in P21 compared to NB rat, and in human compared to rat cells.
Figure 7
Figure 7. Temporal regulation of cytoplasmic localisation
Hippocampal progenitor cells were differentiated in serum for 1–14 days. They were then immunostained with antibodies (green) recognizing A2/B1 (all isoforms), exon 8/10 (A2b and B1b) or exon 9 (A2 and B1). They were also immnostained for neurofilaments (red) to visualize processes and establish neuronal identity. A) Representative confocal images of cells that had been differentiated for 6 or 14 days and immunostained for A2/B1 isoforms. Neurofilament immunostaining for the same cells are shown in the insets. Images were taken at similar exposure intensities. B) Graph showing changes in density of stained granules in processes with increasing number of days differentiated, as quantified using NIH Image Analyzer. Bars represent standard deviation. * p<0.05 vs. A2/B1 staining, n.s. no significant difference from A2/B1 staining.
Figure 8
Figure 8. A2RE RNA granule assembly is blocked by isoform-specific antibodies
Representative confocal images of rat oligodendrocytes coinjected with fluorescently labeled MBP RNA mixed with A) water, B) exon 9 antibody or C) exon 8/10 antibody. Labeled granules are present in the perikaryon and processes of cells microinjected with anti-exon 9 antibody or water, whereas in cells microinjected with anti-exon 8/10 antibody RNA remains diffuse. Insets represent 3X magnification of boxed regions. Scale bar indicates 20 microns. D) Graph of fraction of cells with granules under the three conditions. Numbers of cells analyzed were 32 with no antibody, 38 with ex9 antibody and 25 with ex8/10 antibody. Error bars indicate standard deviations for a binomial distribution calculated as σ = (p(1 − p)/n)1/2. Fisher’s exact test indicates that for cells with no antibody and ex9 antibody the null hypothesis is accepted (treatments do not affect outcomes) with two tailed P value of 1.000000000, whereas for cells with no antibody and ex8/10 antibody the null hypothesis is rejected (treatments affect outcomes) with two-tailed P value of 0.000618902).

Similar articles

Cited by

References

    1. Sossin WS, DesGroseillers L. Intracellular trafficking of RNA in neurons. Traffic. 2006;7(12):1581–1589. - PubMed
    1. Martin KC, Zukin RS. RNA trafficking and local protein synthesis in dendrites: An overview. J Neurosci. 2006;26(27):7131–7134. - PMC - PubMed
    1. Shan JG, Munro TP, Barbarese E, Carson JH, Smith R. A molecular mechanism for mRNA trafficking in neuronal dendrites. J Neurosci. 2003;23(26):8859–8866. - PMC - PubMed
    1. Gao Y, Tatavarty V, Korza G, Levin MK, Carson JH. Multiplexed Dendritic Targeting of {alpha} Calcium Calmodulin-dependent Protein Kinase II, Neurogranin, and Activity-regulated Cytoskeleton-associated Protein RNAs by the A2 Pathway. Mol Biol Cell. 2008;19(5):2311–2327. - PMC - PubMed
    1. Ainger K, Avossa D, Morgan F, Hill SJ, Barry C, Barbarese E, Carson JH. Transport and localisation of exogenous myelin basic protein messenger-RNA microinjected into oligodendrocytes. J Cell Biol. 1993;123(2):431–441. - PMC - PubMed

Publication types

MeSH terms

LinkOut - more resources