. 2010 Apr 20:5:21.
doi: 10.1186/1745-6150-5-21.

Selection in spatial stochastic models of cancer: migration as a key modulator of fitness

Affiliations

Selection in spatial stochastic models of cancer: migration as a key modulator of fitness

Craig J Thalhauser et al. Biol Direct. .

Abstract

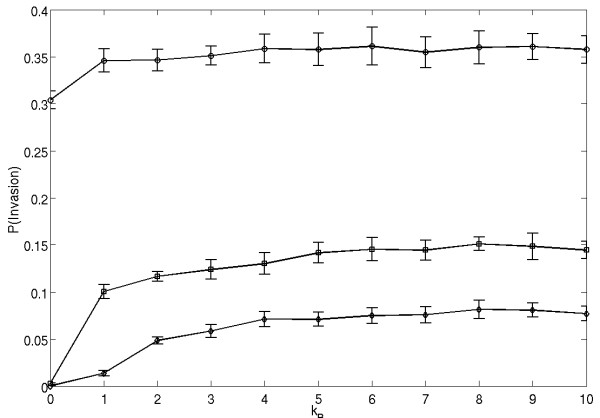
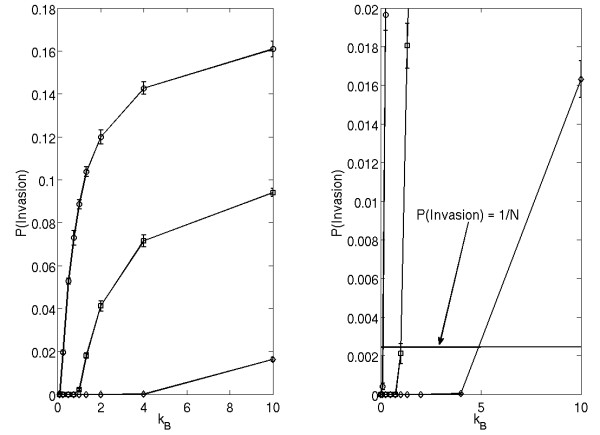
Background: We study the selection dynamics in a heterogeneous spatial colony of cells. We use two spatial generalizations of the Moran process, which include cell divisions, death and migration. In the first model, migration is included explicitly as movement to a proximal location. In the second, migration is implicit, through the varied ability of cell types to place their offspring a distance away, in response to another cell's death.

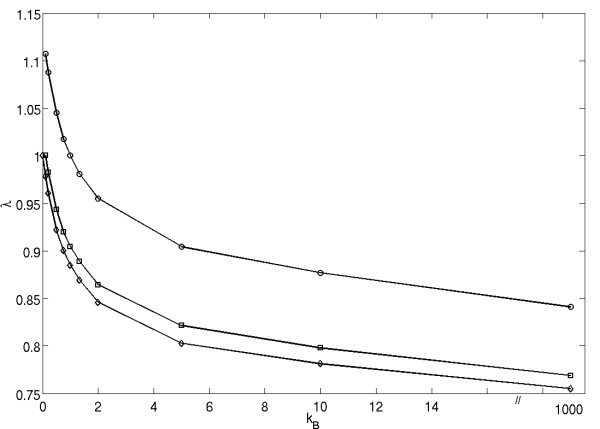
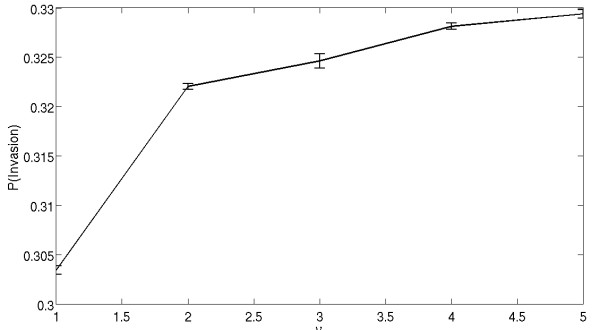
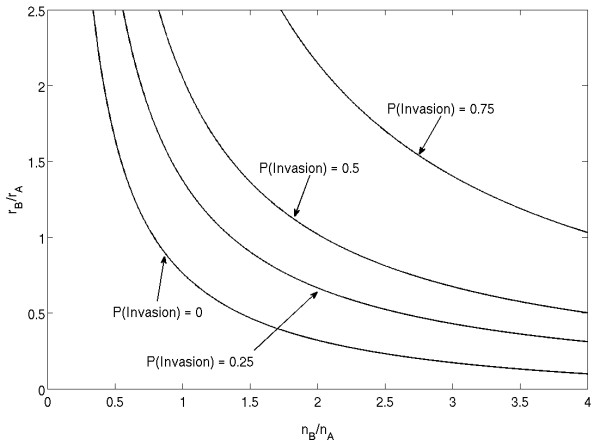
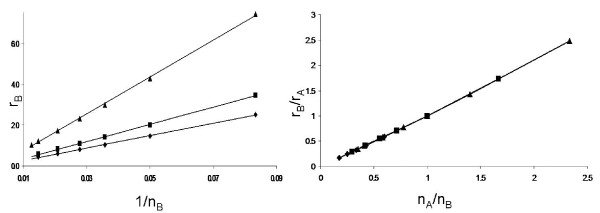
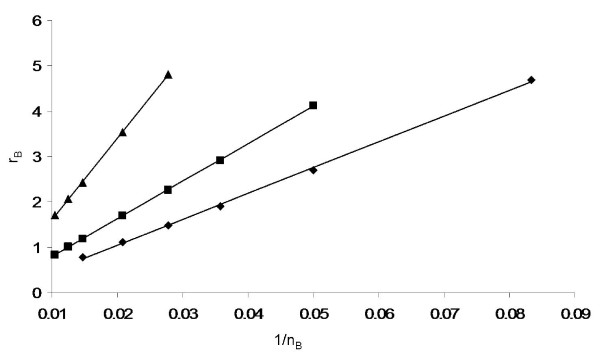
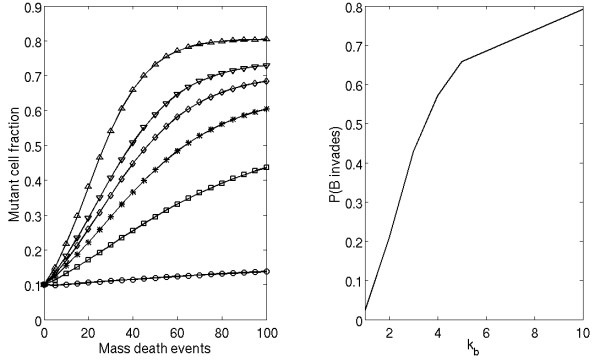
Results: In both models, we find that migration has a direct positive impact on the ability of a single mutant cell to invade a pre-existing colony. Thus, a decrease in the growth potential can be compensated by an increase in cell migration. We further find that the neutral ridges (the set of all types with the invasion probability equal to that of the host cells) remain invariant under the increase of system size (for large system sizes), thus making the invasion probability a universal characteristic of the cells selection status. We find that repeated instances of large scale cell-death, such as might arise during therapeutic intervention or host response, strongly select for the migratory phenotype.

Conclusions: These models can help explain the many examples in the biological literature, where genes involved in cell's migratory and invasive machinery are also associated with increased cellular fitness, even though there is no known direct effect of these genes on the cellular reproduction. The models can also help to explain how chemotherapy may provide a selection mechanism for highly invasive phenotypes.


Figures

Figure 1
Figure 1
Probability of invasion of mutant cells into a kA = 0 background with λ = 1.5 (circles), 1.0 (squares) or 0.9 (diamonds). Plots are the means ± SE of 10 sets of 10000 simulations.
Figure 2
Figure 2
(Left) Probability of invasion of mutant cells into a kA = 1.0 background with = 1.1 (circles), 1.0 (squares) or 0.9 (diamonds). Plots are the means ± SE of 10 sets of 10000 simulations. (Right) Close-up of the low probability regime of the plot. The line indicated corresponds to P(Invasion) = 1/N, the point which describes equal fitness between invader and background.
Figure 3
Figure 3
Strategies of equal fitness (equal invasion probabilities) for background strategies of kA = 0 (diamonds), 0.l (squares) and 1.0 (circles).
Figure 4
Figure 4
The probability of mutant invasion (with rA = 1, rB = 1.5), as a function of cells' division radius, νA = νB = ν. The simulations are performed on a square grid of size 21 × 21.
Figure 5
Figure 5
The level sets of the mutant invasion probability in the parameters space (nB, rB). The background parameters are rA = 2 and nA = 20.
Figure 6
Figure 6
Inverse relationship between rB and nB for strategies of equal fitness (P(Invasion) = 1/N). (Left) Strategies of equal fitness were computed for background strategies of (rA, νA) = (2.5, 2.0) (diamonds), (2.0, 2.5) (squares), and (3.0, 3.0) (triangles). (Right) Plot of the same strategies of equal fitness scaled to their background environment.
Figure 7
Figure 7
Inverse relationship between rB and nB for strategies of fixed invasion probability. Strategies with invasion probability 0.25 (diamonds), 0.5 (squares) and 0.75 (diamonds) were computed for the background strategy in figure 5, ((rA, νA) = (2.5, 2.0).
Figure 8
Figure 8
Effects of a mass death probability on motility phenotype fitness. (Left) Enrichment of slower growth, higher motility mutant cells (λ = 0.8, kB > 0) into a background of kA = 0 cells under successive iterations of a mass death. Pd = 0.8. Plots correspond to kB = 1 (circles), kB = 2 (squares), kB = 3 (asterisks), kB = 4 (diamonds), kB = 5 (downward triangles), and kB = 10 (upward triangles). (Right) Probability of invasion of λ = 0.8 mutant cells as a function of motility strength (kB) under a mass death assumption (Pd = 0.8).

Similar articles

Cited by

References

    1. Hanahan D, Weinberg R. The hallmarks of cancer. CELL. 2000;100(1):57–70. doi: 10.1016/S0092-8674(00)81683-9. - DOI - PubMed
    1. Nowell P. The clonal evolution of tumor cell populations. Science. 1976;194:23–28. doi: 10.1126/science.959840. - DOI - PubMed
    1. Breivik J, Gaudernack G. Carcinogenesis and natural selection: a new perspective to the genetics and epigenetics of colorectal cancer. Adv Cancer Res. 1999;76:187–212. full_text. - PubMed
    1. Gatenby R, Maini P. Mathematical oncology: cancer summed up. Nature. 2003;421:321. doi: 10.1038/421321a. - DOI - PubMed
    1. Nowak M, Sigmund K. Evolutionary dynamics of biological games. Science. 2004;303:793–799. doi: 10.1126/science.1093411. - DOI - PubMed

Publication types