. 2010 Apr 20:11:196.
doi: 10.1186/1471-2105-11-196.

Shared probe design and existing microarray reanalysis using PICKY

Affiliations

Shared probe design and existing microarray reanalysis using PICKY

Hui-Hsien Chou. BMC Bioinformatics. .

Abstract

Background: Large genomes contain families of highly similar genes that cannot be individually identified by microarray probes. This limitation is due to thermodynamic restrictions and cannot be resolved by any computational method. Since gene annotations are updated more frequently than microarrays, another common issue facing microarray users is that existing microarrays must be routinely reanalyzed to determine probes that are still useful with respect to the updated annotations.

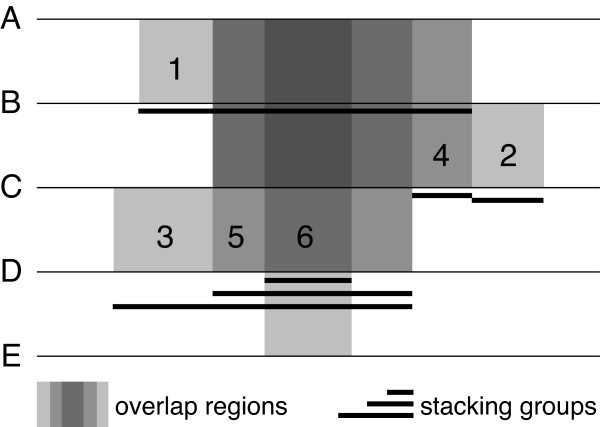
Results: PICKY 2.0 can design shared probes for sets of genes that cannot be individually identified using unique probes. PICKY 2.0 uses novel algorithms to track sharable regions among genes and to strictly distinguish them from other highly similar but nontarget regions during thermodynamic comparisons. Therefore, PICKY does not sacrifice the quality of shared probes when choosing them. The latest PICKY 2.1 includes the new capability to reanalyze existing microarray probes against updated gene sets to determine probes that are still valid to use. In addition, more precise nonlinear salt effect estimates and other improvements are added, making PICKY 2.1 more versatile to microarray users.

Conclusions: Shared probes allow expressed gene family members to be detected; this capability is generally more desirable than not knowing anything about these genes. Shared probes also enable the design of cross-genome microarrays, which facilitate multiple species identification in environmental samples. The new nonlinear salt effect calculation significantly increases the precision of probes at a lower buffer salt concentration, and the probe reanalysis function improves existing microarray result interpretations.


Figures

Figure 1
Figure 1
An example of overlapping gene family sequences. Five sequences A--E can overlap each other in six regions as indicated by the gray colors; darker grays indicate more sequences that overlap. These common regions are represented by suffix groups, which are found on the suffix array and hosted by sequences with the black underlines (i.e., sequences B, C and D). The underlines also indicate the stacking of the suffix groups when a host sequence is being processed.
Figure 2
Figure 2
Example implementation to discover all common region groups that can accommodate probes. suffix_array and common_array are always the same size; i and j are the left and right boundaries of an identified common region group; k saves its left overlap length with nontargets; m saves its right overlap length with nontargets; and n holds the shortest common region within the group.
Figure 3
Figure 3
Example implementation to traverse all host sequences, track their stacking groups and process the groups for shared probe design. r points to each overlap group on a host sequence, which contains four data fields used in this algorithm: Pos, the start of the group on the host sequence, End, the end of the group on the host sequence, Span, the span value of the group, and Next, pointer to the next group; host is the host sequence currently being scanned; pqc counts the total number of distinctive groups on a host sequence; pqs is a collection of priority queues for each associated group; start and end indicated the range of the current group being processed; span records its span value; and next_s is the start position of the next group. Each stack entry in st contains a pair of values: the first is the r pointer to a region as described above, and the second is the pqi index into pqs for storing shared probes designed for a group.
Figure 4
Figure 4
A comparison of linear and nonlinear salt effects. The target and closest nontarget melting temperature differences of 50-mer probes calculated using (a) the linear salt effect equation and (b) the nonlinear salt effect equation are expressed as a function of targeting sequence locations and salt concentrations. For example, the 50-mer probe targeting location 650-699 under 0 salt concentrations has a calculated melting temperature difference of either 25°C or 21°C using the two different equations. The temperature difference exhibits no dependence on salt concentration when calculated using the linear salt effect equation but becomes sensitive to salt concentration when calculated using the nonlinear salt effect equation.
Figure 5
Figure 5
An example of sequences sharing the same probe. In this probe target region view on Gene 685, Genes 657, 1113 and 2212 are collected at the top and shown to contain the same target region. The shorter DNA fragments below them are detected nontargets to the probe. When a fragment is moused over, PICKY dynamically displays an alignment of the fragment-containing sequence (e.g., Gene 1113 as shown) with the target sequence (i.e., Gene 685). The melting temperatures of the probe with all its targets and nontargets are shown in the TEMP column and are used to sort the list.
Figure 6
Figure 6
An information-theoretical comparison of genome complexity. Relative increases of PICKY computation time and additional probes it can find for the 13 model species are shown. When its design constraints are relaxed, PICKY has to compare more probe candidates against nontargets to decide whether these probe candidates can correctly identify their targets. A genome is considered more complex if the extensive thermodynamic comparison identifies more distinguishable gene sequences that can be targeted by microarray probes. For maize, mouse and human, more probes can be gained than the extra time spent to calculate them, which suggests that these species may have more complex genomes.

Similar articles

Cited by

References

    1. Chou HH, Hsia AP, Mooney DL, Schnable PS. Picky: oligo microarray design for large genomes. Bioinformatics. 2004;20:2893–2902. doi: 10.1093/bioinformatics/bth347. - DOI - PubMed
    1. Ma J, Skibbe DS, Fernandes J, Walbot V. Male reproductive development: gene expression profiling of maize anther and pollen ontogeny. Genome biology. 2008;9:R181. doi: 10.1186/gb-2008-9-12-r181. - DOI - PMC - PubMed
    1. Coblentz FE, Towle DW, Shafer TH. Expressed sequence tags from normalized cDNA libraries prepared from gill and hypodermal tissues of the blue crab, Callinectes sapidus. Comparative Biochemistry And Physiology D-Genomics & Proteomics. 2006;1:200–208. - PubMed
    1. Taliercio EW, Boykin D. Analysis of gene expression in cotton fiber initials. BMC Plant Biol. 2007;7:22. doi: 10.1186/1471-2229-7-22. - DOI - PMC - PubMed
    1. Udall JA, Flagel LE, Cheung F, Woodward AW, Hovav R, Rapp RA, Swanson JM, Lee JJ, Gingle AR, Nettleton D. Spotted cotton oligonucleotide microarrays for gene expression analysis. BMC Genomics. 2007;8:81. doi: 10.1186/1471-2164-8-81. - DOI - PMC - PubMed

Publication types

Substances

LinkOut - more resources