

Missing value imputation for epistatic MAPs
- PMID: 20406472
- PMCID: PMC2873538
- DOI: 10.1186/1471-2105-11-197
Missing value imputation for epistatic MAPs
Abstract
Background: Epistatic miniarray profiling (E-MAPs) is a high-throughput approach capable of quantifying aggravating or alleviating genetic interactions between gene pairs. The datasets resulting from E-MAP experiments typically take the form of a symmetric pairwise matrix of interaction scores. These datasets have a significant number of missing values - up to 35% - that can reduce the effectiveness of some data analysis techniques and prevent the use of others. An effective method for imputing interactions would therefore increase the types of possible analysis, as well as increase the potential to identify novel functional interactions between gene pairs. Several methods have been developed to handle missing values in microarray data, but it is unclear how applicable these methods are to E-MAP data because of their pairwise nature and the significantly larger number of missing values. Here we evaluate four alternative imputation strategies, three local (Nearest neighbor-based) and one global (PCA-based), that have been modified to work with symmetric pairwise data.
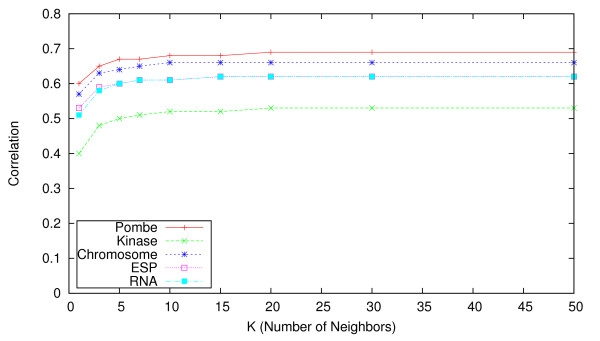
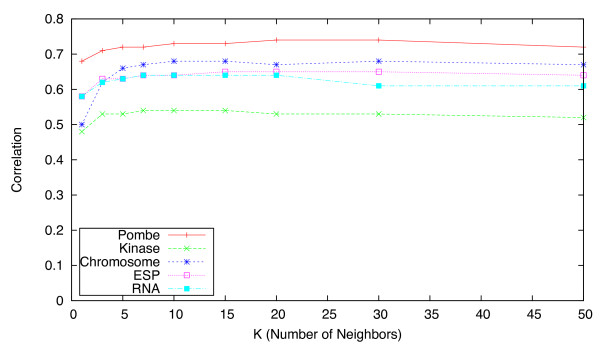
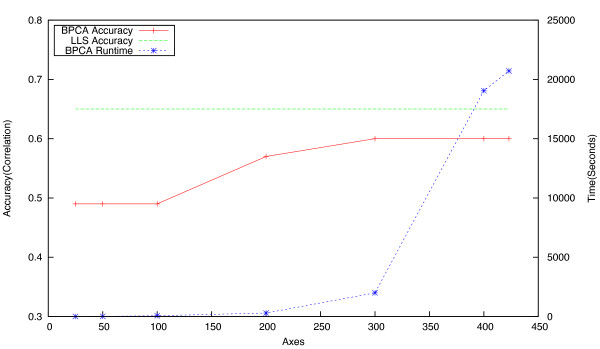
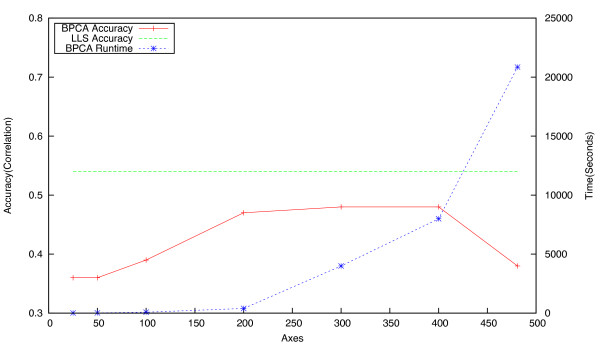
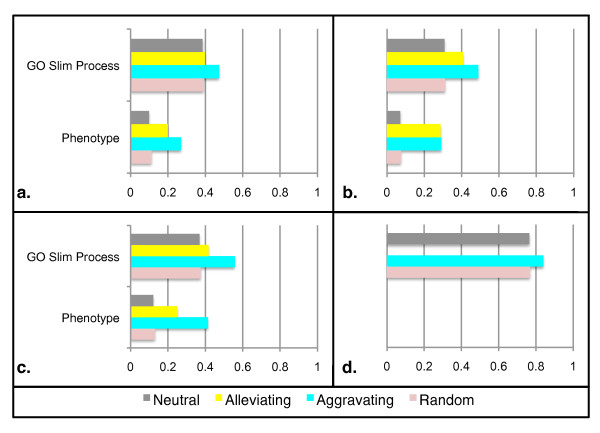
Results: We identify different categories for the missing data based on their underlying cause, and show that values from the largest category can be imputed effectively. We compare local and global imputation approaches across a variety of distinct E-MAP datasets, showing that both are competitive and preferable to filling in with zeros. In addition we show that these methods are effective in an E-MAP from a different species, suggesting that pairwise imputation techniques will be increasingly useful as analogous epistasis mapping techniques are developed in different species. We show that strongly alleviating interactions are significantly more difficult to predict than strongly aggravating interactions. Finally we show that imputed interactions, generated using nearest neighbor methods, are enriched for annotations in the same manner as measured interactions. Therefore our method potentially expands the number of mapped epistatic interactions. In addition we make implementations of our algorithms available for use by other researchers.
Conclusions: We address the problem of missing value imputation for E-MAPs, and suggest the use of symmetric nearest neighbor based approaches as they offer consistently accurate imputations across multiple datasets in a tractable manner.
Figures
Similar articles
-
Imputing and predicting quantitative genetic interactions in epistatic MAPs.Methods Mol Biol. 2011;781:353-61. doi: 10.1007/978-1-61779-276-2_17. Methods Mol Biol. 2011. PMID: 21877290 Free PMC article.
-
Towards better accuracy for missing value estimation of epistatic miniarray profiling data by a novel ensemble approach.Genomics. 2011 May;97(5):257-64. doi: 10.1016/j.ygeno.2011.03.001. Epub 2011 Mar 21. Genomics. 2011. PMID: 21397683
-
Integrative missing value estimation for microarray data.BMC Bioinformatics. 2006 Oct 12;7:449. doi: 10.1186/1471-2105-7-449. BMC Bioinformatics. 2006. PMID: 17038176 Free PMC article.
-
Missing value imputation for gene expression data: computational techniques to recover missing data from available information.Brief Bioinform. 2011 Sep;12(5):498-513. doi: 10.1093/bib/bbq080. Epub 2010 Dec 14. Brief Bioinform. 2011. PMID: 21156727 Review.
-
Dealing with missing values in large-scale studies: microarray data imputation and beyond.Brief Bioinform. 2010 Mar;11(2):253-64. doi: 10.1093/bib/bbp059. Epub 2009 Dec 4. Brief Bioinform. 2010. PMID: 19965979 Review.
Cited by
-
On protocols and measures for the validation of supervised methods for the inference of biological networks.Front Genet. 2013 Dec 3;4:262. doi: 10.3389/fgene.2013.00262. Front Genet. 2013. PMID: 24348517 Free PMC article. Review.
-
Prediction of Genetic Interactions Using Machine Learning and Network Properties.Front Bioeng Biotechnol. 2015 Oct 26;3:172. doi: 10.3389/fbioe.2015.00172. eCollection 2015. Front Bioeng Biotechnol. 2015. PMID: 26579514 Free PMC article. Review.
-
A comprehensive survey on computational learning methods for analysis of gene expression data.Front Mol Biosci. 2022 Nov 7;9:907150. doi: 10.3389/fmolb.2022.907150. eCollection 2022. Front Mol Biosci. 2022. PMID: 36458095 Free PMC article. Review.
-
Data Imputation in Epistatic MAPs by Network-Guided Matrix Completion.J Comput Biol. 2015 Jun;22(6):595-608. doi: 10.1089/cmb.2014.0158. Epub 2015 Feb 6. J Comput Biol. 2015. PMID: 25658751 Free PMC article.
-
Searching for synergies: matrix algebraic approaches for efficient pair screening.PLoS One. 2013 Jul 25;8(7):e68598. doi: 10.1371/journal.pone.0068598. Print 2013. PLoS One. 2013. PMID: 23935877 Free PMC article.
References
-
- Collins SR, Miller KM, Maas NL, Roguev A, Fillingham J, Chu CS, Schuldiner M, Gebbia M, Recht J, Shales M, Ding H, Xu H, Han J, Ingvarsdottir K, Cheng B, Andrews B, Boone C, Berger SL, Hieter P, Zhang Z, Brown GW, Ingles CJ, Emili A, Allis CD, Toczyski DP, Weissman JS, Greenblatt JF, Krogan NJ. Functional dissection of protein complexes involved in yeast chromosome biology using a genetic interaction map. Nature. 2007;446(7137):806–810. doi: 10.1038/nature05649. - DOI - PubMed
Publication types
MeSH terms
LinkOut - more resources
Full Text Sources
