. 2010 Jun;61(10):2575-88.
doi: 10.1093/jxb/erq088. Epub 2010 Apr 20.

RecA maintains the integrity of chloroplast DNA molecules in Arabidopsis

Affiliations

RecA maintains the integrity of chloroplast DNA molecules in Arabidopsis

Beth A Rowan et al. J Exp Bot. 2010 Jun.

Abstract

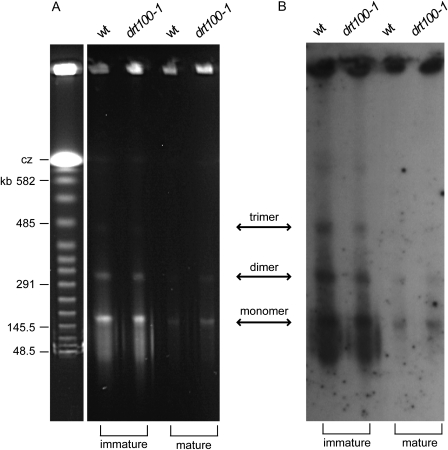
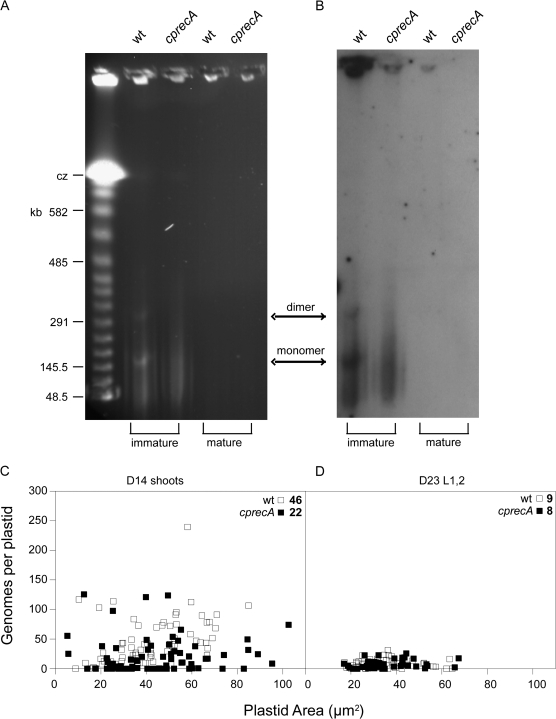
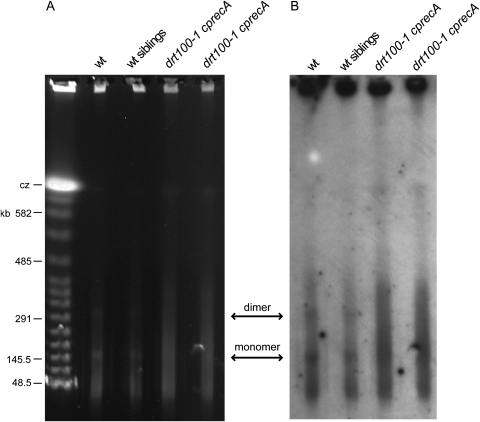
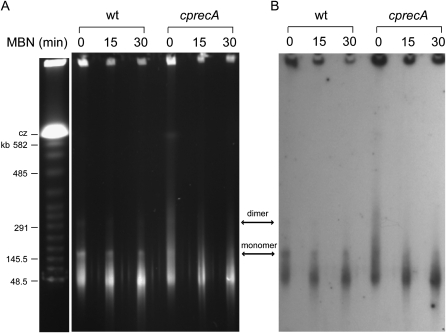
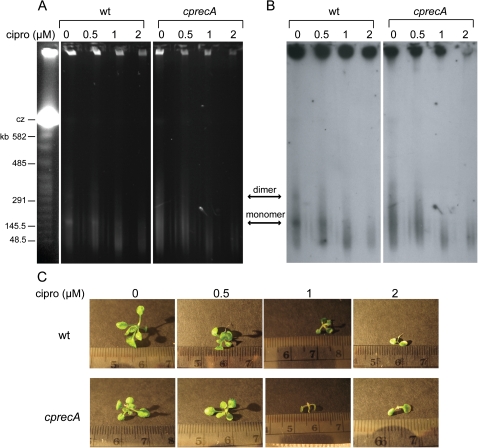
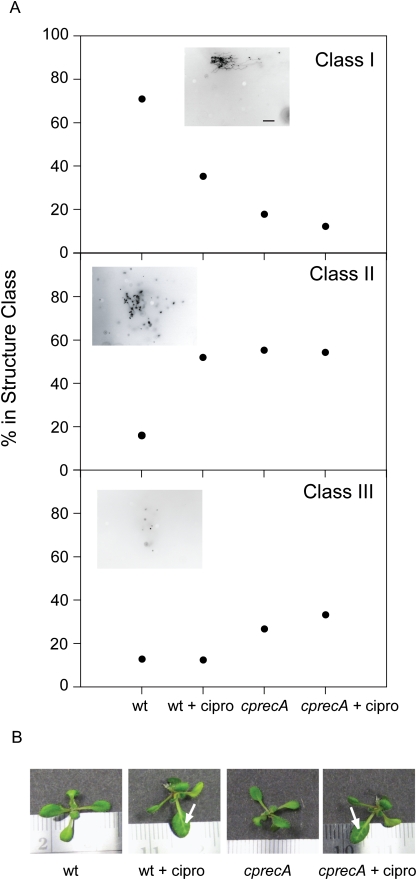
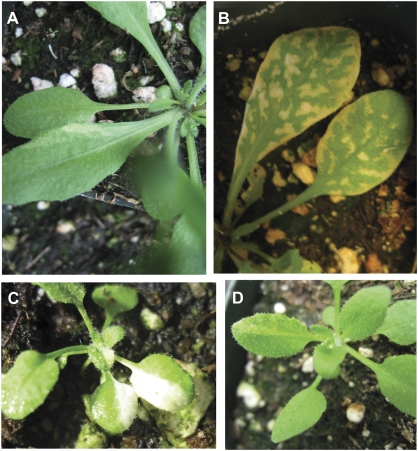
Although our understanding of mechanisms of DNA repair in bacteria and eukaryotic nuclei continues to improve, almost nothing is known about the DNA repair process in plant organelles, especially chloroplasts. Since the RecA protein functions in DNA repair for bacteria, an analogous function may exist for chloroplasts. The effects on chloroplast DNA (cpDNA) structure of two nuclear-encoded, chloroplast-targeted homologues of RecA in Arabidopsis were examined. A homozygous T-DNA insertion mutation in one of these genes (cpRecA) resulted in altered structural forms of cpDNA molecules and a reduced amount of cpDNA, while a similar mutation in the other gene (DRT100) had no effect. Double mutants exhibited a similar phenotype to cprecA single mutants. The cprecA mutants also exhibited an increased amount of single-stranded cpDNA, consistent with impaired RecA function. After four generations, the cprecA mutant plants showed signs of reduced chloroplast function: variegation and necrosis. Double-stranded breaks in cpDNA of wild-type plants caused by ciprofloxacin (an inhibitor of Escherichia coli gyrase, a type II topoisomerase) led to an alteration of cpDNA structure that was similar to that seen in cprecA mutants. It is concluded that the process by which damaged DNA is repaired in bacteria has been retained in their endosymbiotic descendent, the chloroplast.


Figures

Fig. 1.
Fig. 1.
The effect of a T-DNA insertion in DRT100 on cpDNA amount and structure. (A) PFGE of cpDNA obtained from an equal volume of pelleted chloroplasts from wt and drt100-1 mutant plants after staining with ethidium bromide. (B) Blot hybridization of the gel in (A) with an 854 bp cpDNA-specific probe that contains a portion of the petA gene. Similar results were obtained with a different T-DNA insertion allele (drt100-2; data not shown). Immature, entire shoots of plants grown for 16 d post germination; mature, third rosette leaves of plants grown for 30 d post-germination. The ratio of the hybridization signals for each of the lanes is 2.5:2.2:1:1.2 for wt immature:drt100-1 immature:wt mature:drt100-1 mature, respectively. Linear DNA sizes (in kb) are indicated. cz, compression zone.
Fig. 2.
Fig. 2.
The effect of a T-DNA insertion in cpRecA on cpDNA amount and structure. (A) PFGE of cpDNA obtained from an equal volume of pelleted chloroplasts from wt and cprecA mutant plants after staining with ethidium bromide. (B) Blot hybridization of the gel in (A) with a petA probe. Immature, entire shoots of plants grown for 14 d post-germination; mature, first and second rosette leaves from plants grown for 23 d post-germination. The ratio of the hybridization signals for each of the lanes is 6:3.8:1:1.3 for wt immature:cprecA immature:wt mature:cprecA mature, respectively. Linear DNA sizes (in kb) are indicated. cz, compression zone. (C and D) Size and DNA content of plastids isolated from wt and cprecA mutant plants. Genome equivalents per plastid were determined by DAPI staining, using vaccinia virus particles as a standard [results using this method are similar to those using real-time qPCR (Rowan et al., 2009)]. D14 shoots, entire shoots of plants grown for 14 d post-germination. D23 L1,2, first and second rosette leaves from plants grown for 23 d post-germination. Numbers in the upper right corners of (C) and (D) represent the mean of genome equivalents per plastid. The mean μm2 per plastid (and number of plastids analysed) at D14 are 42 (69) for wt and 45 (68) for cprecA. The corresponding values at D23 are 35 (51) for wt and 36 (44) for cprecA. The relative cpDNA amounts among samples are similar when assessed by quantification of the blot hybridization signal (B) and genome copy number (C and D).
Fig. 3.
Fig. 3.
Structure of cpDNA in drt100-1 cprecA double mutants. (A) PFGE of cpDNA obtained from an equal volume of pelleted chloroplasts after staining with ethidium bromide and (B) blot hybridization of the gel in (A) with a petA probe. The cpDNA from wt, wt siblings (F3 wt siblings obtained from the F2 segregating population), and cprecA drt100-1 double mutants (two independent F3 lines obtained from the F2 segregating population) is indicated. As with cprecA single mutants (Fig. 2), the double mutants show no prominent bands of genomic monomers and dimers, and more of the DNA migrates as a smear compared with their wt siblings and unrelated wt (Col) plants. DNA was obtained from chloroplasts isolated from 13-day-old seedlings. Linear DNA sizes (in kb) are indicated. cz, compression zone.
Fig. 4.
Fig. 4.
Detection of single-stranded DNA in wt and cprecA mutants. (A) PFGE of cpDNA obtained from an equal volume of pelleted chloroplasts from wt and cprecA mutant plants after staining with ethidium bromide. (B) Blot hybridization of the gel in (A) with a petA probe. The cpDNA was treated for 0, 15, and 30 min with mung bean nuclease. Linear molecules from cprecA mutants show a reduction in size with increasing nuclease treatment. The hybridization signal from the well was half as strong after treatment for 15 min or 30 min for both wt and cprecA mutants. Linear DNA sizes (in kb) are indicated. cz, compression zone.
Fig. 5.
Fig. 5.
Structure of cpDNA in wt and cprecA mutants after treatment with ciprofloxacin. (A) PFGE of cpDNA obtained from an equal volume of pelleted chloroplasts from wt and cprecA mutant plants after staining with ethidium bromide. (B) Blot hybridization of the gel in (A) with a petA probe. Plants were grown for 14 d on 0, 0.5, 1, and 2 μM ciprofloxacin. Ciprofloxacin-induced DSBs lead to loss of monomers and dimers in wt plants, similar to cprecA mutants without ciprofloxacin. Ciprofloxacin leads to a reduction in the size of the DNA that migrates as a smear in cprecA mutants. Linear DNA sizes (in kb) are indicated. cz, compression zone. (C) Representative images of wt and cprecA mutant plants after 14 d on 0, 0.5, 1, and 2 μM ciprofloxacin. The small gradations are millimetres. Increasing ciprofloxacin treatment leads to reduced growth in both wt and cprecA mutant plants.
Fig. 6.
Fig. 6.
Comparison of the structural forms of individual cpDNA molecules in wt and cprecA plants after ciprofloxacin treatment. Wt and cprecA plants after 11 d of growth followed by 3 d of treatment with water or 30 μM ciprofloxacin. (A) Deproteinized cpDNA was stained with ethidium bromide, visualized by fluorescence microscopy, and characterized by structural class. Class I structures, complex forms consisting of a network of connected fibres or fibres connected to a large, dense core; class II structures, complex forms with a greater number of unconnected fibres than connected fibres; class III structures, unconnected fibres without a complex form. Representative images of class I, II, and III molecules are shown in the insets. The small dots in the images are shorter fibres of DNA that remained condensed during preparation for fluorescence microscopy. The scale bar in the class I image is 10 μm and applies to all images in (A). The number of molecules examined for wt, wt+cipro, cprecA, and cprecA+cipro was 62, 48, 56, and 57, respectively. No circular forms were observed among these 223 molecules. A chi-squares test of independence showed that the distributions of molecules among classes I–III for wt+cipro, cprecA, and cprecA+cipro differed from the wt (P <0.001). (B) Representative images of wt and cprecA plants after treatment with ciprofloxacin. Treatment with ciprofloxacin caused bleaching along the vasculature of older leaves of both wt and cprecA mutant plants. Arrows indicate bleaching along the vasculature. The small gradations are millimetres.
Fig. 7.
Fig. 7.
Phenotypes of cprecA mutants. Representative images of four cprecA mutant phenotypes. (A) Green and white variegated sectors. (B) Necrosis of tissue farthest from vasculature. (C) Albino sectors. (D) Green and yellow variegated sectors. Since none of the wt plants derived from the T-DNA insertion line exhibited an abnormal phenotype after seven generations, the abnormal phenotypes of cprecA mutants can be attributed to T-DNA disruption of the cpRecA gene and not to additional T-DNA insertions that may be present in this line.

Comment in

Similar articles

Cited by

References

    1. Aguilera A, Gomez-Gonzalez B. Genome instability: a mechanistic view of its causes and consequences. Nature Reviews Genetics. 2008;9:204–217. - PubMed
    1. Backert S, Dorfel P, Börner T. Investigation of plant organellar DNAs by pulsed-field gel electrophoresis. Current Genetics. 1995;28:390–399. - PubMed
    1. Bendich AJ, Smith SB. Moving pictures and pulsed-field gel electrophoresis show linear DNA molecules from chloroplasts and mitochondria. Current Genetics. 1990;17:421–425. - PubMed
    1. Birky CW., Jr The inheritance of genes in mitochondria and chloroplasts: laws, mechanisms, and models. Annual Review of Genetics. 2001;35:125–148. - PubMed
    1. Bohr VA, Anson RM. Mitochondrial DNA repair pathways. Journal of Bioenergetics and Biomembranes. 1999;31:391–398. - PubMed

Publication types