. 2010 Jun 25;285(26):20262-72.
doi: 10.1074/jbc.M110.132662. Epub 2010 Apr 20.

Signaling responses to pulsatile gonadotropin-releasing hormone in LbetaT2 gonadotrope cells

Affiliations

Signaling responses to pulsatile gonadotropin-releasing hormone in LbetaT2 gonadotrope cells

Rie Tsutsumi et al. J Biol Chem. .

Abstract

The hypothalamic neuropeptide gonadotropin-releasing hormone (GnRH) is secreted in a pulsatile fashion by hypothalamic neurons, and alterations in pulse frequency and amplitude differentially regulate gonadotropin synthesis and release. In this study, we investigated the kinetics of G(s) and G(q) signaling in response to continuous or pulsatile GnRH using fluorescence resonance energy transfer reporters in live mouse LbetaT2 gonadotrope cells. cAMP and protein kinase A-dependent reporters showed a rapid but transient increase in fluorescence resonance energy transfer signal with increasing doses of constant GnRH, and in contrast diacylglycerol (DAG) and calcium reporters showed a rapid and sustained signal. Multiple pulses of GnRH caused multiple pulses of cAMP and protein kinase A activation without desensitization, but the DAG and calcium reporters were rapidly desensitized resulting in inhibition of calcium and DAG responses. At the transcriptional level, both a cAMP-dependent cAMP-response element reporter and a DAG/calcium-dependent AP-1 reporter showed a pulse frequency-dependent increase in luciferase activity. However, constant GnRH stimulation gave very little cAMP-response element activation but very strong AP-1 activation. Based on these data, we propose that both the GnRH-R-G(s) and G(q) pathways are responsive to pulses of GnRH, but only the G(q) pathway is responsive to constant GnRH. Furthermore, the G(q) pathway is subject to desensitization with multiple GnRH pulses, but the G(s) pathway is not.


Figures

FIGURE 1.
FIGURE 1.
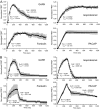
GnRH pulse treatment induces pulses of cAMP generation. A, LβT2 cells were incubated in serum-free media at 37 °C for 16 h. GnRH (1, 10, or 100 nm) was then added for 5 min and then washed away, and the cells were incubated for additional times as indicated. Intracellular cAMP was determined on cell lysates by enzyme immunoassay. Data are from three separate experiments done in triplicate wells. Results are means ± S.D. Asterisks indicate significance versus untreated p < 0.05. B, cells were transfected with the cAMP-dependent ICUE reporter and cAMP levels monitored by FRET. Graphs show normalized FRET from cells stimulated with constant 1 nm (blue), 10 nm (green), or 100 nm (red) GnRH. Black bar indicates the period of GnRH treatment. C, graphs show normalized FRET from transfected cells stimulated with a single 5-min pulse of 1 nm (blue), 10 nm (green), or 100 nm (red) GnRH. After pulse treatment, cells were washed out with Hanks' media with 25 mm HEPES and 1% glucose at 37 °C. Black bar indicates the period of GnRH treatment. d–F, cAMP levels in transfected cells were monitored by FRET in response to multiple GnRH pulses over a 4-h perfusion. Graphs show normalized emission ratio (cyan/yellow) from cells stimulated with GnRH at 1 nm (blue), 10 nm (green), or 100 nm (red) GnRH for 5 min every 120 min (D), every 60 min (E), or every 30 min (F). Arrows indicate GnRH pulses. Data are the mean of three to four independent assays. G, mean normalized FRET signal for pulses of 1, 10, and 100 nm GnRH (n = 14). H, area under the curve of mean FRET signal. *** indicates p < 0.001 versus 1 nm GnRH; ### indicates p < 0.001 versus 10 nm GnRH. I, inhibition of phosphodiesterases augments FRET signal but does not change the kinetics. Cells were transfected with the cAMP-dependent ICUE3 reporter and cAMP levels monitored by FRET. Graphs show normalized FRET from cells stimulated with 10 nm GnRH for 5 min then stimulation with 10 nm GnRH for 5 min in the presence of 50 μm isobutylmethylxanthine.
FIGURE 2.
FIGURE 2.
Other Gs-coupled receptors do not show the same pattern of cAMP generation. Cells were transfected with the cAMP-dependent ICUE reporter and cAMP levels monitored by FRET. A, stimulation of FRET by perfusion of constant 10 nm GnRH, 10 μm isoproterenol, 20 nm PACAP, and 10 μm forskolin for 20 min. B, stimulation of FRET by perfusion of a 5-min pulse of 10 nm GnRH, 10 μm isoproterenol, 20 nm PACAP, and 10 μm forskolin. Graphs show normalized FRET (mean ± S.E.) from ICUE-transfected cells. Curves were fit to exponential increases, decreases, or bell-shaped curves. kon and koff are the on- and off-rates, respectively, and t½ is the half-life of the response.
FIGURE 3.
FIGURE 3.
GnRH pulse treatment induces pulses of PKA activity. A, LβT2 cells were incubated in serum-free media at 37 °C for 16 h. GnRH (1, 10, or 100 nm) was added for 5 min and then washed away, and cells were incubated for further times as indicated. PKA kinase activity was determined on cell extracts. Asterisks indicate significant difference from vehicle-treated control, p < 0.05. Data are expressed as fold basal activity (mean ± S.D.) from three samples. B, cells were transfected with the PKA-dependent AKAR3 reporter, and PKA activity was monitored by FRET. Graphs show normalized FRET from cells perfused with constant 1 nm (blue), 10 nm (green), or 100 nm (red) GnRH. Black bar indicates the period of GnRH treatment. C, graphs show normalized FRET from cells perfused with a single 5-min pulse of 1 nm (blue), 10 nm (green), or 100 nm (red) GnRH. After pulse treatment, cells were washed out with Hanks' with 25 mm HEPES and 1% glucose at 37 °C. D–F, PKA activity in transfected cells was monitored by FRET in response to multiple GnRH pulses over a 4-h perfusion. Graphs show normalized FRET from cells stimulated with GnRH at 1 nm (blue), 10 nm (green), or 100 nm (red) GnRH for 5 min every 120 min (D), every 60 min (E, or every 30 min (F). Arrows indicate GnRH pulses. Data are the mean of three to four independent assays. G, mean normalized FRET signal for pulses of 1, 10, and 100 nm GnRH (n = 14). H, area under the curve of mean FRET signal. * and *** indicate p < 0.05 or 0.001 versus 1 nm GnRH; ### indicates p < 0.001 versus 10 nm GnRH.
FIGURE 4.
FIGURE 4.
Dephosphorylation determines signaling waveform. A, cells were transfected with the PKA-dependent AKAR2 reporter, and PKA activity was monitored by FRET. Graphs show normalized FRET from cells perfused with constant 1 nm (blue), 10 nm (green), or 100 nm (red) GnRH. Black bar indicates the period of GnRH treatment. B, graphs show normalized FRET from cells perfused with a single 5-min pulse of 1 nm (blue), 10 nm (green), or 100 nm (red) GnRH. After pulse treatment, cells were washed out with Hanks' media with 25 mm HEPES and 1% glucose at 37 °C. Black bar indicates the period of GnRH treatment. C–E, PKA activity in transfected cells was monitored by FRET in response to multiple GnRH pulses over a 4-h perfusion. Graphs show normalized FRET from cells perfused with GnRH at 1 nm (blue), 10 nm (green), or 100 nm (red) GnRH was for 5 min every 120 min (C), every 60 min (D), or every 30 min (E). Arrows indicate GnRH pulses. Data are the means of three to four independent assays. F, single GnRH pulse induces phosphorylation of CREB. Cells were stimulated with 0.1, 1, 10, or 100 nm GnRH for 5 min, then washed, and incubated for increasing times as indicated. Phosphorylation of CREB in whole cell extracts was assessed by immunoblotting with anti-phospho-CREB (Ser-133). G, qualification of phosphorylated CREB after a single pulse. Data are expressed as fold over basal (mean ± S.D.) for four samples in each condition. Exponential decay curves were fit using Prism. Asterisks indicate significant differences in fitted curves (p < 0.05).
FIGURE 5.
FIGURE 5.
GnRH pulse treatment induces pulses of diacylglycerol. A, cells were transfected with the DAG-dependent DAGR reporter and DAG levels monitored by FRET. Graphs show normalized FRET from cells perfused with constant 1 nm (blue), 10 nm (green), or 100 nm (red) GnRH. Black bar indicates the period of GnRH treatment. B, graphs show normalized FRET from cells perfused with a single 5-min pulse of 1 nm (blue), 10 nm (green), or 100 nm (red) GnRH. After pulse treatment, cells were washed out with Hanks' media with 25 mm HEPES and 1% glucose at 37 °C. Black bar indicates the period of GnRH treatment. C–E, DAG levels in transfected cells were monitored by FRET in response to multiple GnRH pulses over a 4-h perfusion. Graphs show normalized FRET from cells stimulated with 10 nm GnRH for 5 min every 120 min (C), every 60 min (D), or every 30 min (E). Arrows indicate GnRH pulses. Data are the means of three to four independent assays.
FIGURE 6.
FIGURE 6.
GnRH pulse treatment induces pulses of calcium. A, cells were transfected with the calcium-dependent GCaMP2 reporter, and calcium levels were monitored by EGFP fluorescence. Graphs show normalized EGFP emission from cells perfused with constant 1 nm (blue), 10 nm (green), or 100 nm (red) GnRH. Black bar indicates the period of GnRH treatment. B and C, cells were transfected with the GCaMP2 reporter and calcium levels monitored by EGFP fluorescence in response to multiple GnRH pulses over a 4-h perfusion. Graphs show normalized EGFP emission from cells stimulated with 100 nm GnRH for 5 min every 30 min (B) or every 60 min (C). Arrows indicate GnRH pulses. Data are the means of two to three independent assays. d–F, GCaMP2-expressing cells were treated with multiple 10 nm GnRH pulses over a 4-h perfusion. Graphs show normalized EGFP emission from cells stimulated for 5 min every 30 min (D), every 60 min (E), or every 30 min in the presence of the proteosomal inhibitor MG-132 (F). Arrows indicate GnRH pulses. Data are the means of two to three independent assays.
FIGURE 7.
FIGURE 7.
Response of CRE- and AP-1-dependent transcription to GnRH pulses. Cells were transfected with the Cre-luciferase reporter plasmid (A) or AP-1-luciferase reporter plasmid (B) and then stimulated with multiple pulses of vehicle (white), 1 nm (blue), 10 nm (green), or 100 nm (red) GnRH at 30-, 60-, or 120-min intervals for 6 h. Parallel wells received either a single GnRH pulse or tonic GnRH. Asterisks indicate significant differences between GnRH treatment and vehicle-treated control, p < 0.05.
FIGURE 8.
FIGURE 8.
Model for signaling via Gs and Gq/11. A, response of the Gs-cAMP-PKA and Gq/11-DAG/calcium pathways to constant GnRH. B, response of the same pathways to pulsatile GnRH. CaMK, calmodulin-dependent kinase.

References

    1. Conn P. M., Crowley W. F., Jr. (1994) Annu. Rev. Med. 45, 391–405 - PubMed
    1. Kaiser U. B., Conn P. M., Chin W. W. (1997) Endocr. Rev. 18, 46–70 - PubMed
    1. Marshall J. C., Eagleson C. A., McCartney C. R. (2001) Mol. Cell. Endocrinol. 183, 29–32 - PubMed
    1. Grosse R., Schmid A., Schöneberg T., Herrlich A., Muhn P., Schultz G., Gudermann T. (2000) J. Biol. Chem. 275, 9193–9200 - PubMed
    1. Han X. B., Conn P. M. (1999) Endocrinology 140, 2241–2251 - PubMed

Publication types

MeSH terms

LinkOut - more resources