. 2010 Jun 18;285(25):19288-98.
doi: 10.1074/jbc.M110.134213. Epub 2010 Apr 20.

Sterol-induced dislocation of 3-hydroxy-3-methylglutaryl coenzyme A reductase from endoplasmic reticulum membranes into the cytosol through a subcellular compartment resembling lipid droplets

Affiliations

Sterol-induced dislocation of 3-hydroxy-3-methylglutaryl coenzyme A reductase from endoplasmic reticulum membranes into the cytosol through a subcellular compartment resembling lipid droplets

Isamu Z Hartman et al. J Biol Chem. .

Abstract

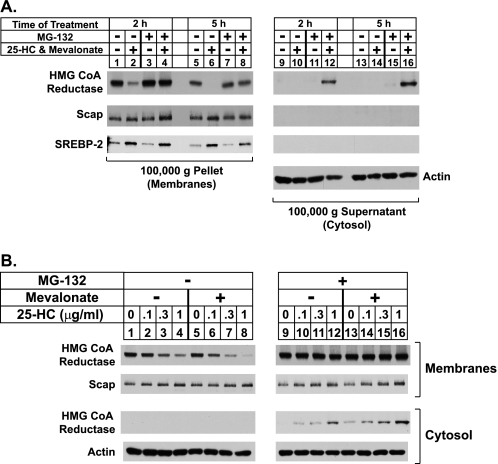
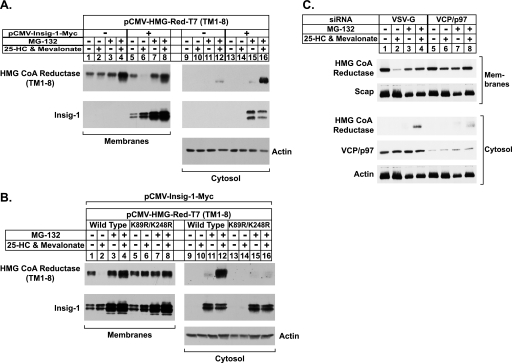
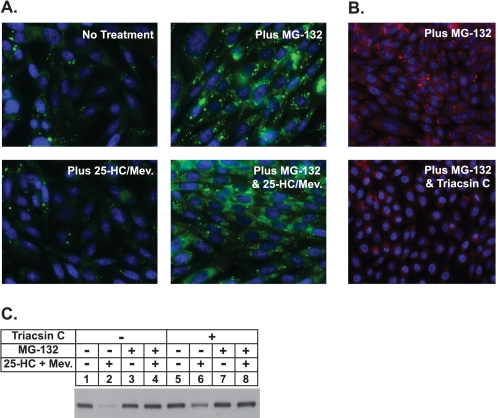
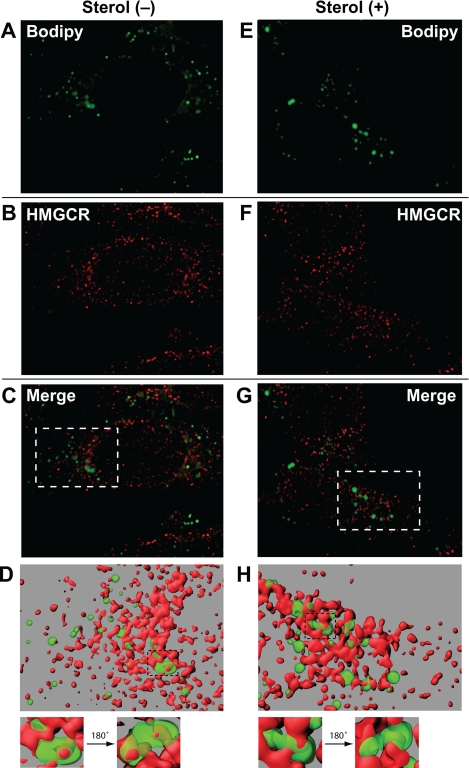
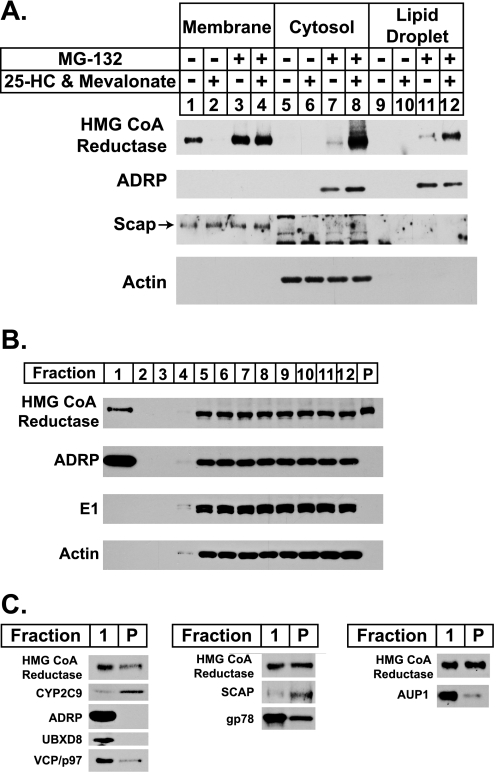
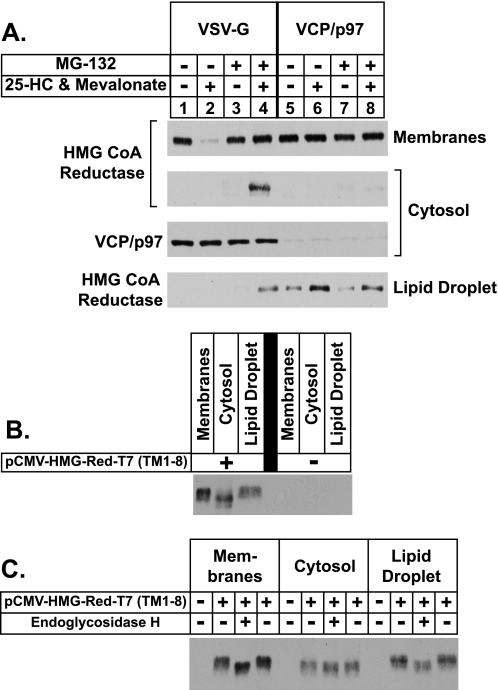
Sterol-induced binding to Insigs in the endoplasmic reticulum (ER) allows for ubiquitination of 3-hydroxy-3-methylglutaryl coenzyme A reductase, the rate-limiting enzyme in cholesterol synthesis. This ubiquitination marks reductase for recognition by the ATPase VCP/p97, which mediates extraction and delivery of reductase from ER membranes to cytosolic 26 S proteasomes for degradation. Here, we report that reductase becomes dislocated from ER membranes into the cytosol of sterol-treated cells. This dislocation exhibits an absolute requirement for the actions of Insigs and VCP/p97. Reductase also appears in a buoyant fraction of sterol-treated cells that co-purifies with lipid droplets, cytosolic organelles traditionally regarded as storage depots for neutral lipids such as triglycerides and cholesteryl esters. Genetic, biochemical, and localization studies suggest a model in which reductase is dislodged into the cytosol from an ER subdomain closely associated with lipid droplets.


Figures

FIGURE 1.
FIGURE 1.
Sterol-mediated dislocation of HMG-CoA reductase from ER membranes into the cytosol of CHO-K1 cells. A and B, CHO-K1 cells were set up for experiments on day 0 at a density of 5 × 10⁵ cells per 100-mm dish in medium A containing 5% FCS. On day 2 the cells were washed with PBS and refed medium A supplemented with 5% LPDS, 10 μm sodium compactin, and 50 μm sodium mevalonate. After 16 h at 37 °C, cells were switched to medium A containing 5% LPDS, 10 μm compactin, and the indicated additions. A, cells were treated in the absence (−) or presence (+) of 1 μg/ml 25-HC, 10 mm mevalonate, and 10 μm MG-132 as indicated. After incubation at 37 °C for 2 h (lanes 1–4 and 9–12) or 5 h (lanes 5–8 and 13–16), the cells were harvested and subjected to cell fractionation as described under “Experimental Procedures.” Aliquots of 100,000 × g pellet (7.5 μg protein/lane) and supernatant (20 μg protein/lane) fractions, designated membranes and cytosol, respectively, were subjected to SDS-PAGE and transferred to supported nitrocellulose membranes followed by immunoblot analysis with 5 μg/ml monoclonal IgG-A9 (against reductase), 5 μg/ml polyclonal IgG-R139 (against Scap), 5 μg/ml monoclonal IgG-7D4 (against SREBP-2), or 1:2000 dilution of polyclonal anti-actin IgG. B, cells were incubated with various concentrations of 25-HC in the absence (−) or presence (+) of 10 μm MG-132 and 10 mm mevalonate as indicated. After 5 h at 37 °C, the cells were harvested and subjected to cell fractionation followed by immunoblot analysis as in A.
FIGURE 2.
FIGURE 2.
Sterol-mediated dislocation of HMG-CoA reductase into cytosol requires its prior ubiquitination and the actions of Insig-1 and VCP/p97. A and B, CHO-K1 cells were set up for experiments on day 0 at a density of 4 × 10⁵ cells per 60-mm dish in medium A containing 5% FCS. On day 1 cells were transfected in 2 ml of medium A containing 5% LPDS with 1 μg of wild-type or K89R/K248R versions of pCMV-HMG-Red-T7 (TM1–8) in the absence or presence of 30 ng of pCMV-Insig1-Myc as indicated. The total amount of DNA in each dish was adjusted to 1.03 μg per dish by the addition of pcDNA3.1 mock vector. After 3–6 h at 37 °C, the cells received a direct addition of 2 ml of medium A containing 5% LPDS, 20 μm compactin, and 100 μm mevalonate. After incubation for 16 h at 37 °C, cells were switched to medium A containing 5% LPDS and 10 μm compactin in the absence (−) or presence (+) of 1 μg/ml 25-HC, 10 mm mevalonate, and 10 μm MG-132 as indicated. After 5 h at 37 °C, cells were harvested and subjected to cell fractionation as described under “Experimental Procedures.” Aliquots of the membrane (7.5–8 μg of protein/lane) and cytosol (20 μg of protein/lane) fractions were subjected to SDS-PAGE, and immunoblot analysis was carried out with 0.5 μg/ml monoclonal anti-T7 IgG (against reductase), 0.5 μg/ml monoclonal IgG-9E10 (against Insig-1), or 1:2000 dilution of polyclonal anti-actin IgG. C, CHO-K1 cells were set up on day 0 at a density of 2 × 10⁵ cells per 60-mm dish in medium A containing 5% FCS. On day 1 cells were transfected with the indicated siRNA duplexes (100 pmol per dish) as described under “Experimental Procedures.” After transfection, cells were incubated for 16 h at 37 °C in medium A containing 5% LPDS, 10 μm compactin, and 50 μm mevalonate. On day 2 cells were switched to medium A containing 5% LPDS and 10 μm compactin in the absence (−) or presence (+) of 1 μg/ml 25-HC, 10 mm mevalonate, and 10 μm MG-132 as indicated. After 5 h at 37 °C, cells were harvested and subjected to cell fractionation as described under “Experimental Procedures.” Aliquots of the membrane (8 μg protein/lane) and cytosol (30 μg protein/lane) fractions were subjected to SDS-PAGE, and immunoblot analysis was carried out with 5 μg/ml monoclonal IgG-A9 (against reductase), 5 μg/ml polyclonal IgG-R139 (against Scap), 0.625 μg/ml monoclonal IgG-18 (against VCP/p97), and a 1:2000 dilution of polyclonal anti-actin IgG.
FIGURE 3.
FIGURE 3.
Proteasome inhibition stimulates formation of lipid droplets in CHO-K1 cells. A, on day 0 CHO-K1 cells were set up on glass coverslips at a density of 2 × 10⁵ cells per well of 6-well plates in medium A containing 5% FCS. On day 1 cells were refed medium A supplemented with 5% LPDS, 10 μm compactin, and 50 μm mevalonate (Mev.). After 16 h at 37 °C, cells were switched to medium A containing 5% LPDS and 10 μm compactin in the absence or presence of 10 μm MG-132 and 1 μg/ml 25-hydroxycholesterol plus 10 mm mevalonate as indicated. After incubation for 5 h at 37 °C, cells were washed twice with PBS, fixed with 4% paraformaldehyde, permeabilized with 0.1% Triton X-100, and stained with 10 μg/ml BODIPY 493/503 (green) to visualize lipid droplets or Hoechst reagent (blue) to visualize nuclei using standard procedures. Images were acquired with Zeiss AxioPlan 2E (Thornwood, NY) and a Hamamatsu monochrome camera (63× objective, Bridgewater, NJ). B and C, on day 0 CHO-K1 cells were plated at 2 × 10⁵ cells per well of 6-well plates with glass coverslips or at 4 × 10⁵ cells per 100 mm dish in medium A containing 5% FCS. On day 2 cells were refed medium A supplemented with 5% delipidated fetal calf serum, 10 μm compactin, and 50 μm mevalonate. After 16 h at 37 °C, cells were switched to medium A containing 5% LPDS and 10 μm compactin without (−) or with (+) 9.6 μm triacsin C. After 3.25 h at 37 °C, cells were treated in the absence (−) or presence (+) of 9.6 μm triacsin C, 10 μm MG-132, and 1 μg/ml 25-HC plus 10 mm mevalonate as indicated. B, after 4 h at 37 °C cells on the coverslips were stained with Oil Red O and Hoechst by standard methods. C, cells on the 100-mm dishes were harvested after 4 h at 37 °C, and membrane fractions were obtained as described under “Experimental Procedures.” Aliquots of the membrane fractions (10 μg protein/lane) were subjected to SDS-PAGE and transferred to supported nitrocellulose membranes followed by immunoblot analysis with 5 μg/ml monoclonal IgG-A9 (against reductase).
FIGURE 4.
FIGURE 4.
Association of MG-132-induced lipid droplets with ER membranes containing HMG-CoA reductase. On day 0 CHO-K1 cells were plated at 5 × 10⁴ cells per well of 12-well plates with glass coverslips. On day 1 cells were refed medium A supplemented with 5% LPDS, 10 μm compactin, and 50 μm mevalonate. After 16 h at 37 °C, cells were switched to medium A containing 5% LPDS, 10 μm compactin, and 10 μm MG-132 in the presence or absence of 1 μg/ml 25-hydroxycholesterol plus 10 mm mevalonate as indicated. After incubation for 5 h at 37 °C, cells were washed twice with PBS, fixed with 4% paraformaldehyde, permeabilized with 0.1% Triton X-100, and stained with 10 μg/ml BODIPY 493/503 to visualize lipid droplets (green) and with 50 μg/ml IgG-A9 with 5 μg/ml AlexaFluor 568 goat anti-mouse IgG to visualize reductase (HMGCR; red) using standard procedures. Images were taken using a Deltavision pDV deconvolution microscope (Bitplan, Inc., St. Paul, MN) with an Olympus UPlanApo 100× oil immersion objective. Z slices were taken at 0.2-μm intervals through the thickness of the cell (∼25 slices) and were deconvolved using SoftWoRx software using the default settings. The middle five slices of the deconvolved Z stack were used to generate surface volume renderings using Imaris software (Bitplane, Inc.). Segmentation was carried out interactively to obtain surfaces that most closely matched the localization of lipid droplets and reductase staining. The green surface was rendered at 45% transparency to reveal red structures contained within green structures. The maximum intensity projection of the Z slices are shown in A–C and E–G. The surface volume renderings are shown in D and H.
FIGURE 5.
FIGURE 5.
Sterol-regulated localization of HMG-CoA reductase to the buoyant, ADRP-enriched lipid droplet fraction. A and B, CHO-K1 cells were set up for experiments on day 0 at a density of 5 × 10⁵ cells per 100-mm dish in medium A containing 5% FCS. On day 2 cells were washed with phosphate-buffered saline and refed medium A with 5% LPDS, 10 μm compactin, and 50 μm mevalonate. A, after incubation for 16 h at 37 °C, cells were switched to medium A containing 5% LPDS and 10 μm compactin in the absence (−) or presence (+) of 1 μg/ml 25-HC, 10 mm mevalonate, and 10 μm MG-132 as indicated. After 5 h at 37 °C, cells were washed with PBS, harvested, and lysed by Dounce homogenization (40 strokes). The resulting lysates were subjected to centrifugation at 1000 × g for 10 min at 4 °C to obtain a post-nuclear supernatant, which was transferred to a new tube and subjected to an additional centrifugation step at 250,000 × g for 30 min. The top 100 μl of the resulting supernatant was designated the lipid droplet fraction, 700 μl of the underlying supernatant was designated the cytosol, and the pellet (P) was designated the membrane fraction. Aliquots of membrane (0.5 μg of protein/lane), cytosol (20 μg of protein/lane), and lipid droplet (4 μg of protein/lane) fractions were subjected to SDS-PAGE and analyzed by immunoblot analysis with 5 μg/ml monoclonal IgG-A9 (against reductase), 1:500 dilution of monoclonal IgG-AP125 (against ADRP), 5 μg/ml polyclonal IgG-R139 (against Scap), and 1:2000 dilution of polyclonal anti-actin IgG. B, 60 plates of CHO-K1 cells were treated with 10 μm MG-132 for 45 min at 37 °C followed by treatment with 1 μg/ml 25-HC, 10 mm mevalonate, and 10 μm MG-132 for an additional 4 h at 37 °C. Cells were then harvested, and lysates were prepared in 10 ml of Buffer A as described under “Experimental Procedures.” The resulting lysates were centrifuged at 1000 × g for 7 min to obtain a post-nuclear supernatant, which was transferred to an ultracentrifuge tube, overlaid with Buffer A containing a reduced concentration of sucrose, and subjected to centrifugation at 150,000 × g for 1 h. The top 2 ml of the supernatant (fraction 1) containing of the lipid droplet fraction was isolated using a tube slicer. The remainder of the supernatant was fractionated by removing 1-ml aliquots from the top of the tube (fractions 2–12). The lipid droplet fraction was concentrated through centrifugation at 16,000 × g for 8 min and removal of the translucent infranatant. All supernatant fractions were precipitated with acetone and resuspended in Buffer B. The membrane pellet fraction (P) was resuspended in 2 ml of Buffer B. Aliquots of each fraction (fraction 1: 4.4% of total; fraction 2–12: 1.58% of total; fraction P: 0.0075% of total) were subjected to SDS-PAGE, and immunoblot analysis was carried out with 4 μg/ml monoclonal IgG-A9 (against reductase), 1:2000 dilution of guinea pig polyclonal anti-ADRP antibody, 1.67 μg/ml rabbit polyclonal anti-E1 IgG, and 1:2000 dilution of rabbit polyclonal anti-actin IgG (Sigma A2066) as indicated. C, the lipid droplet fraction (Fraction 1) and the membrane pellet fraction (P) from B were loaded for SDS-PAGE such that the two would yield equivalent signal intensity when transferred to nitrocellulose filters and immunoblotted with 4 μg/ml of monoclonal IgG-A9 (against reductase). The nitrocellulose filters were also immunoblotted with 1:500 dilution of rabbit polyclonal anti-CYP2C9 antibody, 1:2000 dilution of guinea pig polyclonal anti-ADRP antibody, 0.5 μg/ml goat polyclonal anti-UBXD8/ETEA IgG, 0.625 μg/ml monoclonal IgG-18 (against VCP/p97), 20 μg/ml monoclonal IgG-9D5 (against Scap), 2 μg/ml rabbit polyclonal IgG-740F (against gp78), and 0.05 μg/ml rabbit polyclonal anti-AUP1 antibody.
FIGURE 6.
FIGURE 6.
Sterol-regulated translocation of HMG-CoA reductase into the lipid droplet fraction precedes its dislocation into the cytosol. A, CHO-K1 cells were set up on day 0 at a density of 5 × 10⁵ cells per 100-mm dish in medium A containing 5% FCS. On day 1 cells were transfected with the indicated duplex of siRNA (120 pmol per dish) as described under “Experimental Procedures.” After transfection, cells were incubated for 16 h at 37 °C in medium A containing 5% LPDS, 10 μm compactin, and 50 μm mevalonate. The cells were then treated in the absence (−) or presence (+) of 10 μm MG-132 in medium A containing 5% LPDS and 10 μm compactin for 1 h at 37 °C followed by treatment in the absence (−) or presence (+) of 1 μg/ml 25-HC, 10 mm mevalonate, and 10 μm MG-132 as indicated. After 5 h at 37 °C, cells were harvested and subjected to cell fractionation as described under “Experimental Procedures.” Aliquots of membrane (5 μg of protein/lane), lipid droplet (5 μg of protein/lane), and cytosol (25 μg of protein/lane) fractions were subjected to SDS-PAGE, and immunoblot analysis was carried out with 4 μg/ml monoclonal IgG-A9 (against reductase) or 0.625 μg/ml monoclonal IgG-18 (against VCP/p97). B and C, CHO-K1 cells were set up for experiments on day 0 at a density of 5 × 10⁵ cells per 100-mm dish in medium A containing 5% FCS. On day 2 cells were transfected in 6 ml of medium A containing 5% LPDS with either 5.82 μg of wild type pCMV-HMG-Red-T7 (TM1–8) and 180 ng of pCMV-Insig1-Myc or 6 μg of pcDNA3.1 mock vector. After 5 h at 37 °C, cells received a direct addition of 2 ml of medium A containing 5% LPDS, 40 μm compactin, and 200 μm mevalonate. After incubation for 16 h at 37 °C, the cells were treated with 10 μm MG-132 for 45 min at 37 °C followed by treatment with 1 μg/ml 25-HC, 10 mm mevalonate, and 10 μm MG-132 for 4 h at 37 °C. Cells were harvested and subjected to subcellular fractionation; the cytosol and lipid droplet fractions were subjected to acetone precipitation, as described under “Experimental Procedures.” In B, aliquots of these fractions (membrane, 0.006% of total; cytosol, 0.06% of total; lipid droplet, 5% of total) were subjected to SDS-PAGE followed by immunoblot analysis with 0.5 μg/ml monoclonal anti-T7 (against reductase). In C, membrane, cytosol, and lipid droplet fractions were dissolved in Buffer B and subjected to incubation in the absence (−) or presence (+) of endoglycosidase Hf (EndoHf; 130 units of enzyme/μg of protein) for 5 h at 37 °C. After incubations, the samples were subjected to SDS-PAGE and immunoblot analysis as in B.

References

    1. Brown M. S., Goldstein J. L. (1980) J. Lipid Res 21, 505–517 - PubMed
    1. Roitelman J., Olender E. H., Bar-Nun S., Dunn W. A., Jr., Simoni R. D. (1992) J. Cell Biol. 117, 959–973 - PMC - PubMed
    1. Liscum L., Finer-Moore J., Stroud R. M., Luskey K. L., Brown M. S., Goldstein J. L. (1985) J. Biol. Chem. 260, 522–530 - PubMed
    1. Nakanishi M., Goldstein J. L., Brown M. S. (1988) J. Biol. Chem. 263, 8929–8937 - PubMed
    1. Sever N., Yang T., Brown M. S., Goldstein J. L., DeBose-Boyd R. A. (2003) Mol. Cell 11, 25–33 - PubMed

Publication types