. 2010 Jun;255(3):772-80.
doi: 10.1148/radiol.10091735. Epub 2010 Apr 20.

Assessment of renal fibrosis with diffusion-weighted MR imaging: study with murine model of unilateral ureteral obstruction

Affiliations

Assessment of renal fibrosis with diffusion-weighted MR imaging: study with murine model of unilateral ureteral obstruction

Osamu Togao et al. Radiology. 2010 Jun.

Abstract

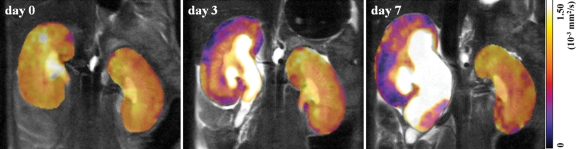
Purpose: To test, in a murine model of unilateral ureteral obstruction (UUO), whether the magnetic resonance (MR) imaging-derived apparent diffusion coefficient (ADC) changes during the progression of renal fibrosis and correlates with the histopathologic changes observed in renal fibrogenesis.

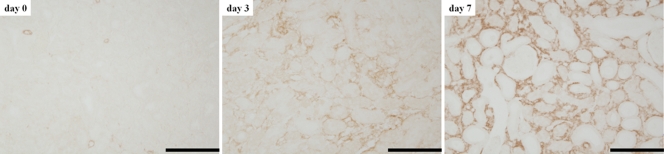
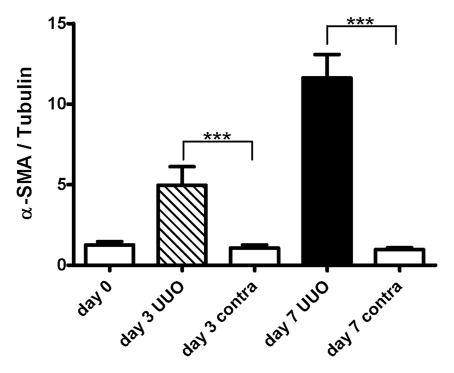
Materials and methods: This study was approved by the institutional animal care and use committee. A UUO was created in each of 14 mice. In five mice, longitudinal diffusion-weighted (DW) imaging was performed before the UUO (day 0) and on days 3 and 7 after the UUO and was followed by histopathologic analysis. The nine remaining mice were examined with cross-sectional studies on days 0 (n = 4) and 3 (n = 5). ADCs were measured with a spin-echo echo-planar sequence at five b values ranging from 350 to 1200 sec/mm(2). Differences in ADC among the time points and between the sides were assessed by using Tukey-Kramer and Student t tests, respectively. ADC was correlated with cell density and alpha-smooth muscle actin (alpha-SMA, a marker of myofibroblasts) expression at linear regression analysis.

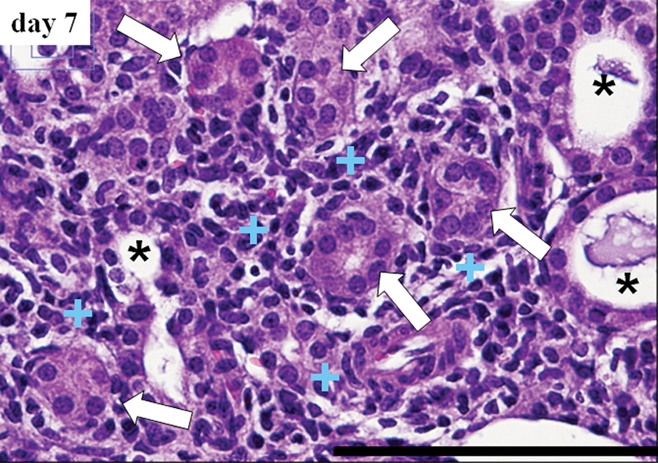
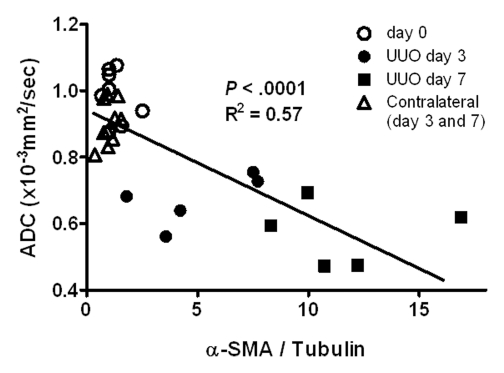
Results: Histopathologic examination revealed typical renal fibrosis on the side with UUO. The ADC decreased over time on the UUO side, from (1.02 +/- 0.06 [standard deviation]) x 10(-3) mm(2)/sec on day 0 to (0.70 +/- 0.08) x 10(-3) mm(2)/sec on day 3 (P < .001) and (0.57 +/- 0.10) x 10(-3) mm(2)/sec on day 7 (P < .001). The percentage change in ADC was greater on the UUO side than on the contralateral side on days 3 (29% +/- 9, P = .05) and 7 (44% +/- 11, P < .01). ADC correlated with both increased cell density and increased alpha-SMA expression (P < .001 for both correlations).

Conclusion: An ADC decrease in renal fibrosis is associated with an increased number of cells, including fibroblasts. ADC has the potential to serve as a sensitive noninvasive biomarker of renal fibrosis.


Figures

Figure 1:
Figure 1:
Diagram illustrates study design and assignment of mice to study groups. Five mice in group 1 were examined with longitudinal diffusion-weighted (DW) imaging (solid arrows) before UUO (day 0) and on days 3 and 7 after UUO. For histopathologic correlation at each diffusion-weighted imaging time point (dotted arrows), an additional group of mice were examined on days 0 (group 2, four mice) and 3 (group 3, five mice).
Figure 2a:
Figure 2a:
(a) Typical coronal ADC maps of the kidneys in a mouse in group 1 before UUO (day 0) and on days 3 and 7 after UUO. ADCs were averaged over three orthogonal directions to eliminate possible anisotropic effect. (b) Graph illustrates changes in renal cortex ADC, which decreased in a time-dependent manner on the UUO side (five mice in group 1). All data are expressed as percentage changes, in means ± standard deviations, relative to baseline value, with P = .05 (*)and P < .01 (**) for comparisons of UUO and contralateral sides at unpaired two-tailed Student t testing.
Figure 2b:
Figure 2b:
(a) Typical coronal ADC maps of the kidneys in a mouse in group 1 before UUO (day 0) and on days 3 and 7 after UUO. ADCs were averaged over three orthogonal directions to eliminate possible anisotropic effect. (b) Graph illustrates changes in renal cortex ADC, which decreased in a time-dependent manner on the UUO side (five mice in group 1). All data are expressed as percentage changes, in means ± standard deviations, relative to baseline value, with P = .05 (*) and P < .01 (**) for comparisons of UUO and contralateral sides at unpaired two-tailed Student t testing.
Figure 3a:
Figure 3a:
(a) Micrographs of renal cortex before UUO (day 0) and on days 3 and 7 after UUO show evolution of massive cells. (Hematoxylin-eosin stain; original magnification, ×400.) (b) A field in the day 7 sample (magnification, ×400) demonstrates morphologic changes manifested by tubular atrophy (arrows), tubular dilatation (*), and expanded interstitial space filled with numerous cells (+). Bars = 100 μm.
Figure 3b:
Figure 3b:
(a) Micrographs of renal cortex before UUO (day 0) and on days 3 and 7 after UUO show evolution of massive cells. (Hematoxylin-eosin stain; original magnification, ×400.) (b) A field in the day 7 sample (magnification, ×400) demonstrates morphologic changes manifested by tubular atrophy (arrows), tubular dilatation (*), and expanded interstitial space filled with numerous cells (+). Bars = 100 μm.
Figure 4:
Figure 4:
Renal cortex specimens immunohistochemically stained for α-SMA expression (original magnification, ×400) before UUO (day 0) and on days 3 and 7 after UUO. Stained area and cell density gradually increase over time, indicating proliferation of α-SMA–positive myofibroblasts. Bars = 100 μm.
Figure 5a:
Figure 5a:
(a) Bar graph illustrates mean cell density in renal cortex before UUO (day 0, eight kidneys) and on days 3 (five kidneys for each side) and 7 (five kidneys for each side) after UUO. On day 0, data were obtained in both kidneys as they were intact (eight kidneys), with P ≤ .001 (***) for comparison of UUO and contralateral (contra)sides at unpaired two-tailed Student t testing. (b) Graph illustrates relationship between ADC and cell density, which were measured in corresponding locations and had a strong correlation (P < .001, R2 = 0.74; simple regression analysis).
Figure 5b:
Figure 5b:
(a) Bar graph illustrates mean cell density in renal cortex before UUO (day 0, eight kidneys) and on days 3 (five kidneys for each side) and 7 (five kidneys for each side) after UUO. On day 0, data were obtained in both kidneys as they were intact (eight kidneys), with P ≤ .001 (***) for comparison of UUO and contralateral (contra)sides at unpaired two-tailed Student t testing. (b) Graph illustrates relationship between ADC and cell density, which were measured in corresponding locations and had a strong correlation (P < .001, R2 = 0.74; simple regression analysis).
Figure 6a:
Figure 6a:
(a) Western blot analysis of α-SMA expression. Upper panels were probed with antibody that recognizes α-SMA. Lower panels were probed with antibody that recognizes tubulin, with tubulin expression used as internal control. (b) Graph illustrates mean amounts of α-SMA in kidney (α-SMA-to-tubulin expression ratios) before UUO (day 0, eight kidneys) and on days 3 (five kidneys for each side) and 7 (five kidneys for each side) after UUO. On day 0, data were obtained in both kidneys as they were intact (eight kidneys), with P < .001 (***) for comparisons of UUO and contralateral sides at unpaired two-tailed Student t testing. (c) Graph illustrates relationship between ADC and total amount of α-SMA; data indicate a strong correlation (P < .001, R2 = 0.57; simple regression analysis).
Figure 6b:
Figure 6b:
(a) Western blot analysis of α-SMA expression. Upper panels were probed with antibody that recognizes α-SMA. Lower panels were probed with antibody that recognizes tubulin, with tubulin expression used as internal control. (b) Graph illustrates mean amounts of α-SMA in kidney (α-SMA-to-tubulin expression ratios) before UUO (day 0, eight kidneys) and on days 3 (five kidneys for each side) and 7 (five kidneys for each side) after UUO. On day 0, data were obtained in both kidneys as they were intact (eight kidneys), with P < .001 (***) for comparisons of UUO and contralateral sides at unpaired two-tailed Student t testing. (c) Graph illustrates relationship between ADC and total amount of α-SMA; data indicate a strong correlation (P < .001, R2 = 0.57; simple regression analysis).
Figure 6c:
Figure 6c:
(a) Western blot analysis of α-SMA expression. Upper panels were probed with antibody that recognizes α-SMA. Lower panels were probed with antibody that recognizes tubulin, with tubulin expression used as internal control. (b) Graph illustrates mean amounts of α-SMA in kidney (α-SMA-to-tubulin expression ratios) before UUO (day 0, eight kidneys) and on days 3 (five kidneys for each side) and 7 (five kidneys for each side) after UUO. On day 0, data were obtained in both kidneys as they were intact (eight kidneys), with P < .001 (***) for comparisons of UUO and contralateral sides at unpaired two-tailed Student t testing. (c) Graph illustrates relationship between ADC and total amount of α-SMA; data indicate a strong correlation (P < .001, R2 = 0.57; simple regression analysis).

Comment in

References

    1. Levey AS, Stevens LA, Coresh J. Conceptual model of CKD: applications and implications. Am J Kidney Dis 2009;53(3suppl 3):S4–S16 - PubMed
    1. Coresh J, Selvin E, Stevens LA, et al. Prevalence of chronic kidney disease in the United States. JAMA 2007;298(17):2038–2047 - PubMed
    1. Hewitson TD. Renal tubulointerstitial fibrosis: common but never simple. Am J Physiol Renal Physiol 2009;296(6):F1239–F1244 - PubMed
    1. Nath KA. Tubulointerstitial changes as a major determinant in the progression of renal damage. Am J Kidney Dis 1992;20(1):1–17 - PubMed
    1. Bohle A, Wehrmann M, Bogenschütz O, Batz C, Müller CA, Müller GA. The pathogenesis of chronic renal failure in diabetic nephropathy: investigation of 488 cases of diabetic glomerulosclerosis. Pathol Res Pract 1991;187(2-3):251–259 - PubMed